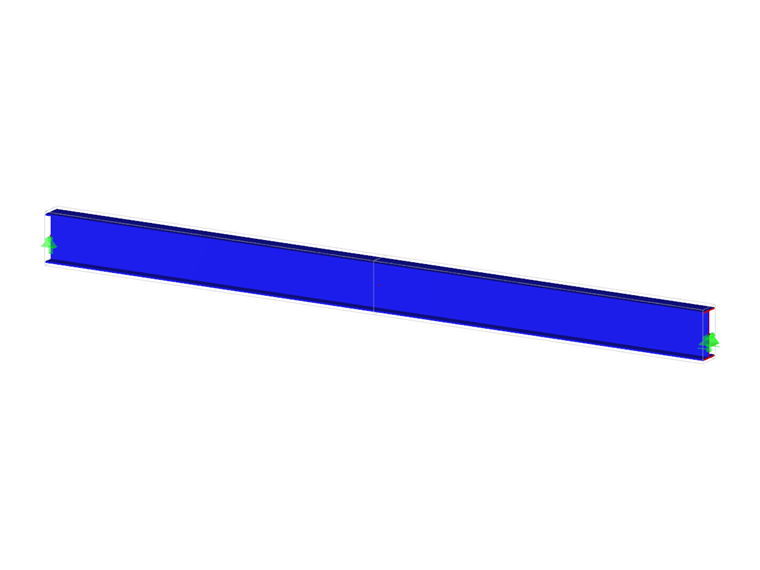
Description
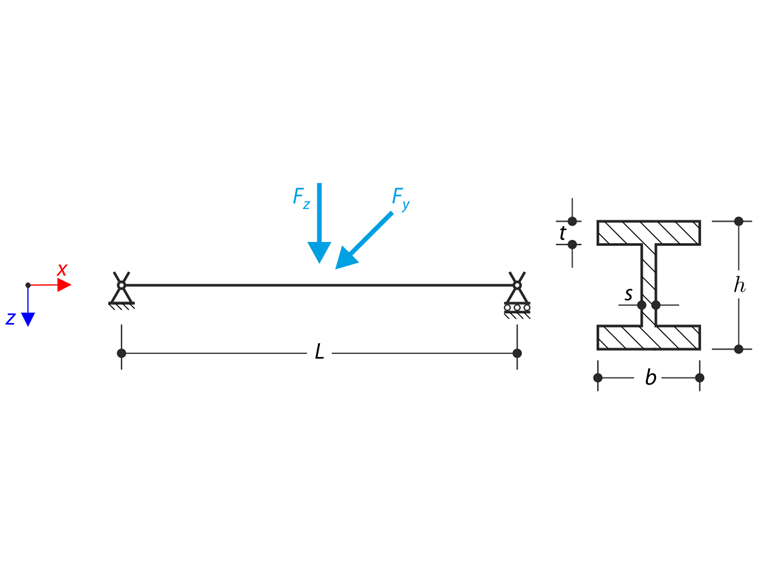
The axial rotation of the I-profile is restricted on the both ends by means of the fork supports (warping is not restricted). The structure is loaded by two transverse forces in its middle. The self-weight is neglected in this example. Determine the maximum deflections of the structure uy,max and uz,max, maximum rotation φx,max, maximum bending moments My,max and Mz,max and maximum torsional moments MT,max, MTpri,max, MTsec,max and Mω,max. The verification example is based on the example introduced by Gensichen and Lumpe (see the reference).
| Material | Steel | Modulus of Elasticity | E | 210000.000 | MPa |
| Poisson´s Ratio | ν | 0.300 | - | ||
| Geometry | Beam | Length | L | 6.000 | m |
| Cross-section | Height | h | 400.000 | mm | |
| Width | b | 180.000 | mm | ||
| Web Thickness | s | 10.000 | mm | ||
| Flange Thickness | t | 14.000 | mm | ||
| Load | Horizontal Force | Fy | 3.000 | kN | |
| Vertical Force | Fz | 194.000 | kN | ||
Analytical Solution
Analytical solution is not available. Results from software S3D are taken as reference.
RFEM and RSTAB Settings
- Modeled in RFEM 5.26, RSTAB 8.26 and RFEM 6.01, RSTAB 9.01
- The element size is lFE= 0.025 m
- Isotropic linear elastic material model is used
- Second-Order Analysis is used
- Torsional Warping and Steel Design add-on is used in RFEM 6 and RSTAB 9
Results
Following graphs ilustrate the behaviour of selected deformations and internal forces calculated in RSTAB 9. Maximum values are sorted and compared in result tables.
![RSTAB 9 Results - Deformation uy [mm]](/en/webimage/047726/3730013/uy.png?mw=760&hash=3d56f1ef3484e8bde6553b48293cba1de22e245e)
![RSTAB 9 Results – Deformation u_z [mm]](/en/webimage/047730/3730088/uz.png?mw=760&hash=042a17fa2d53bb28ba83db919b031670ad1c5000)
![RSTAB 9 Results – Deformation φ_x [mrad]](/en/webimage/047731/3730095/fix.png?mw=760&hash=3d155f25d48f6330446cd5ffd3a8aa21977962ab)
![RSTAB 9 Results – Bending Moment M_y [kNm]](/en/webimage/047732/3730102/My.png?mw=760&hash=1ad0427484ba9403ffbc8536812801acc1376c2e)
![RSTAB 9 Results – Bending Moment M_z [kNm]](/en/webimage/047733/3730139/Mz.png?mw=760&hash=98a3d992359799d6dd58bf9d79c2cbd27ac8346a)
![RSTAB 9 Results – Torional Moment M_T [kNm]](/en/webimage/047734/3730141/MT.png?mw=760&hash=78af42223f0d6d0bd41b42a9755bedd45f26d776)
![RSTAB 9 Results – Primary Torsional Moment M_Tpri [kNm]](/en/webimage/047735/3730144/MTpri.png?mw=760&hash=72061159ce80a9e9ca168ee715f88a6cbc0148e6)
![RSTAB 9 Results – Secondary Torsional Moment M_Tsec [kNm]](/en/webimage/047736/3730151/MTsec.png?mw=760&hash=b7d48c7932aba5bb55632d5c7f9495c112ff7617)
![RSTAB 9 Rresults – Warping Moment Mω [kNm]](/en/webimage/047737/3730153/MTsec.png?mw=760&hash=b7d48c7932aba5bb55632d5c7f9495c112ff7617)
| Quantity | S3D | RFEM 6 | Ratio | RSTAB 9 | Ratio |
| uy,max [mm] | 25.0 | 26.6 | 1.064 | 27.1 | 1.084 |
| uz,max [mm] | 19.8 | 20.8 | 1.051 | 18.9 | 0.955 |
| φx,max [mrad] | 81.0 | 87.7 | 1.083 | 84.1 | 1.038 |
| My,max [kNm] | 290.0 | 289.5 | 0.998 | 289.1 | 0.997 |
| Mz,max [kNm] | -28.0 | -30.0 | 1.071 | -28.7 | 1.025 |
| MT,max [kNm] | 2.38 | 2.56 | 1.034 | 2.45 | 1.029 |
| MTpri,max [kNm] | 1.48 | 1.57 | 1.061 | 1.50 | 1.013 |
| MTsec,max [kNm] | 1.03 | 1.21 | 1.175 | 1.15 | 1.117 |
| Mω,max [kNm] | 2.61 | 2.84 | 1.088 | 2.70 | 1.034 |
| Quantity | S3D | RFEM 5 - RF-FE-LTB | Ratio | RSTAB 8 - FE-LTB | Ratio |
| uy,max [mm] | 25.0 | 28.1 | 1.124 | 28.1 | 1.124 |
| uz,max [mm] | 19.8 | 18.9 | 0.954 | 18.9 | 0.954 |
| φx,max [mrad] | 81.0 | 87.8 | 1.084 | 87.9 | 1.084 |
| My,max [kNm] | 290.0 | 289.0 | 0.997 | 289.0 | 0.997 |
| Mz,max [kNm] | -28.0 | -29.9 | 1.068 | -29.9 | 1.068 |
| MT,max [kNm] | 2.38 | 2.54 | 1.068 | 2.54 | 1.068 |
| MTpri,max [kNm] | 1.48 | 1.57 | 1.061 | 1.57 | 1.061 |
| MTsec,max [kNm] | 1.03 | 1.19 | 1.155 | 1.19 | 1.155 |
| Mω,max [kNm] | 2.61 | 2.77 | 1.061 | 2.78 | 1.061 |