


In the “Navigator – Results”, specify the stresses, stress ratios, stress ranges, or strains to be displayed graphically on surfaces.

For each surface location, the values of the selected result type are displayed in color. In the control panel, you can see the color assignments of the stresses, stress ratios, ranges, or strains.
Layers and Layer Sides
For each stress type, you can select the results for the position in the surface cross-section where the stress is present: top, middle, or bottom. By default, all three check boxes are selected: Thus, the envelope is represented from the maximum values of each layer side.
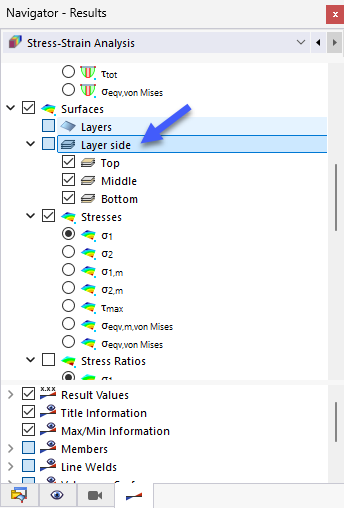
If you want to check the stresses on a specific side, deactivate the irrelevant check boxes. The following image shows the axial stresses on the top and bottom sides of a uniaxially tensioned plate.

If you have defined a surface using layer elements with the Multilayer Surfaces add-on, you can display the stresses of the individual layers.
Strains
If you have activated the Strain analysis check box in the Global Settings dialog box, you can graphically check surface strains.

Again, it is possible to display the results for each layer side.
Values on Surfaces
The "Values on Surfaces" category at the end of the upper navigator area provides various options for displaying result values on the surfaces.

The functions are described in the chapter Result Values on Surfaces of the RFEM manual. You can also use it for evaluating the stress-strain analysis.
The Current Selection option displays the values of the stress or strain type specified in the Navigator above. The result values in the grid or FE mesh points, which can be set in the lower navigator area, thus correspond to the surface gradients (see the image above).
The Groups option allows you to display results for specific stress directions. With this type of display, we recommend you to not show any result diagrams: Rather select the "From" display option in the lower area of the navigator.

Use the Specific option to define the result types for the values related to stress or strain.
