


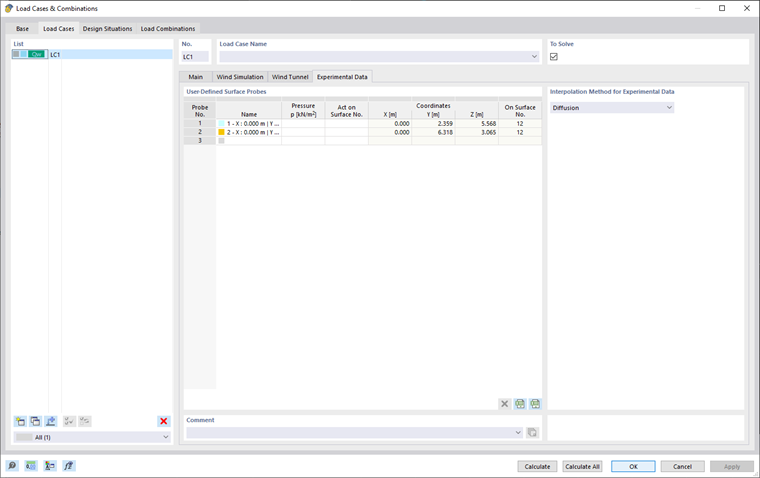
This tab shows the necessary settings for working with experimental data: a table of defined surface result points with experimental pressure values and the selected interpolation method.
User-Defined Surface Probes
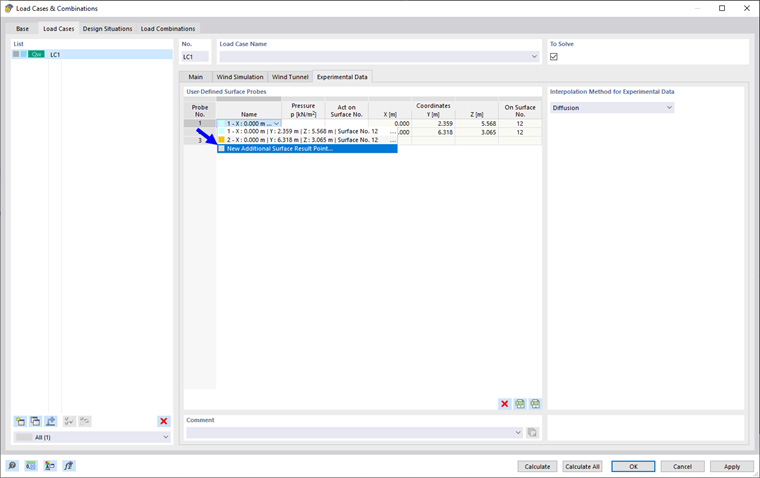
There is a table that contains points with experimental pressure values that are either already entered in the "Additional Surface Result Point" object or can be entered using "New Additional Surface Result Point"...—see the image below.
Additional surface result points are entered in the following dialog:
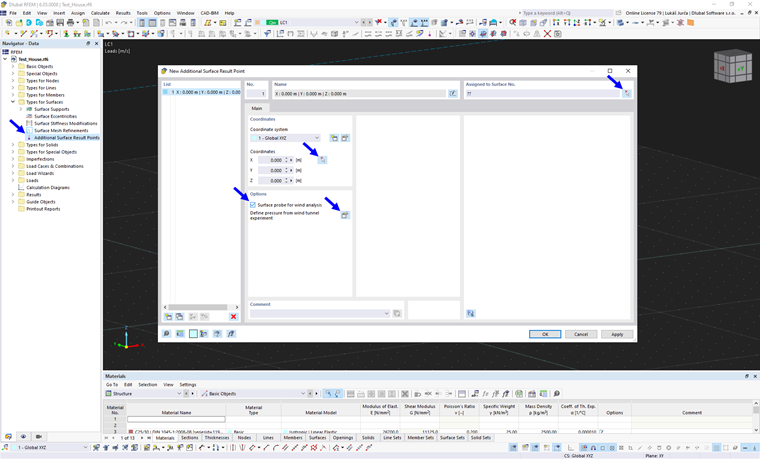
Here, it is necessary to define the surface and the point that lies on it using
![]() and then check "Surface probe for wind analysis"; the points with this checkbox ticked are displayed in the table above. To switch to LC, you can use the button
and then check "Surface probe for wind analysis"; the points with this checkbox ticked are displayed in the table above. To switch to LC, you can use the button
![]() .
.
In the "Pressure" column, we can then enter the value of the experimental pressure at the given point. The subsequent columns contain the coordinates of the point and the area on which the point lies.
Interpolation Method for Experimental Data
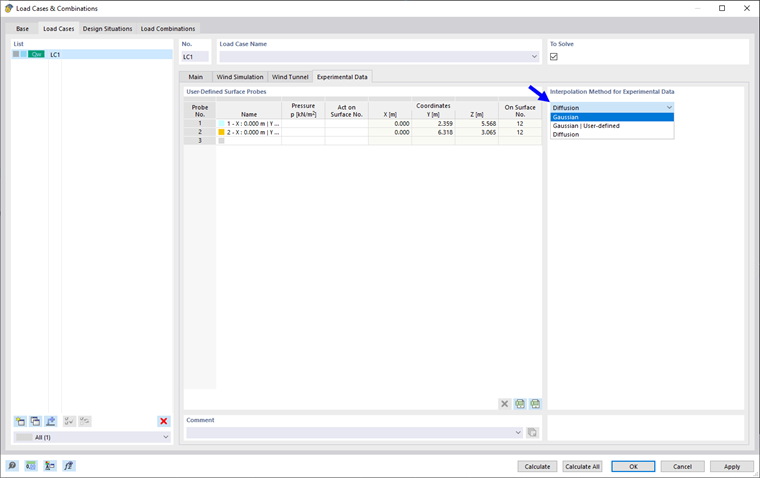
In this section, you can select the method of interpolation of the experimental data. There are two types of interpolation—Gaussian and Diffusion—and for Gaussian interpolation, you can also set user-defined parameters:
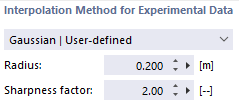
Detailed info about both interpolation methods and parameters can be found in Chapter Probes in the section Verification Data .