


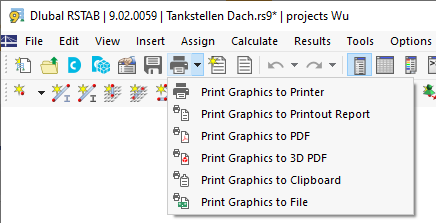
You can use any graphic displayed in the work window for your documentation. This way, you can send graphics to the printer, integrate them into the printout report, or print them as a PDF. Select the appropriate option in the
![]() list button.
list button.
The same applies to the result diagrams of members and member sets as well as cross-section details, which you can print out with the
![]() buttons available in the respective dialog boxes.
buttons available in the respective dialog boxes.
The "Graphic Printout" dialog box appears. Specify the print settings for the image in order to transfer it appropriately to the printer or to the printout report.
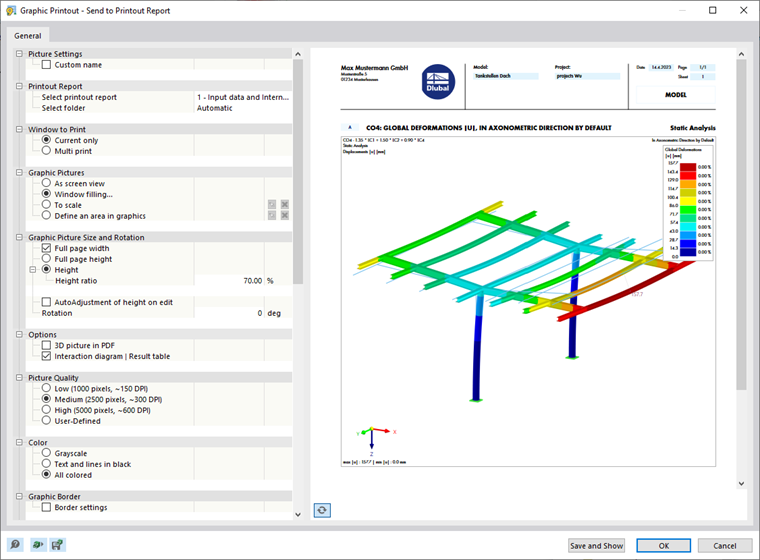
Picture Settings
If you want to change the preset title of the graphic, select the "Custom name" check box. Then, you can enter your own description.
Printout Report
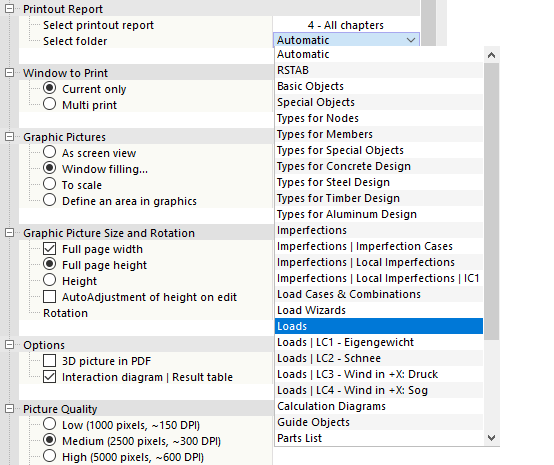
This category is available when sending the graphic to the printout report. In the "Select printout report" list, choose the printout report where the graphic is to be stored.
RSTAB prints the graphic "Automatically" in the corresponding chapter. If you want to assign the graphic to a certain category, select the chapter in the "Select folder" list.
Window to Print
In this category, you can specify whether you want to print the "Current (window) only", or several images. The options for printing several graphics are described in the chapter Using Multi Print.
Graphic Pictures
This category controls the format in which the graphic is positioned on the sheet. It is also possible to define only a part of the view. After each change, you can check the data in the preview.
- As screen view: The same display scale is used as on the monitor. This allows you to print zoomed areas or special views.
- Window filling: The overall view is scaled to the page size. The currently set angle of view is used to display the whole model in the specified Graphic Picture Size. This way, edge areas around the graphic are minimized, or sections are extended to display the entire model.
- To scale: The graphic is printed by the scale that you define in the text box. Again, the current angle of view is used. Use the
 button to define an area of the view for the scale-up printout (see the description below).
- Define an area in graphics: A user-defined area of the view is printed, which you can define graphically via a window. Click the
button next to the selection box. The work window appears with the "Edit Printout Report Picture" dialog box.
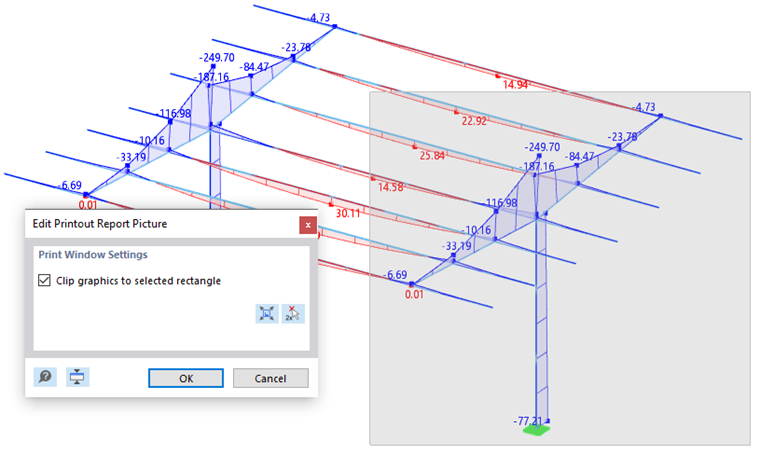
Adjust the area to be printed by moving the window borders. Alternatively, use the
![]() button to define the window by clicking any two points. You can move the window by holding down the mouse button.
button to define the window by clicking any two points. You can move the window by holding down the mouse button.
The
![]() button sets the current view as the area to be printed.
button sets the current view as the area to be printed.
If you clear the "Clip graphics to selected rectangle" check box, the picture to be printed also includes areas of the view that lie outside the rectangle window, depending on the page setting.
Graphic Picture Size and Rotation
Settings in this directory section define the size of the graphic on the sheet. If the "Full page width" check box is selected, the left margin column is also used for the printed image.
If you do not want to use the "Full page height" for the graphic, select the "Height" option. Then, you can define the height ratio of the graphic area in relation to the page height.
Options
If you want to save the image as an interactive 3D graphic in the document, select the "3D picture in PDF" check box. Find general information about 3D PDF documents in the technical article Visual Model Check Using Print to 3D PDF.
The "Interaction diagram | Result table" check box is relevant for the Concrete Design add-on. It allows you to control whether the table with numerical results is displayed in addition to the diagram.
Picture Quality
This category helps you to adjust the resolution for printing. The medium quality is preset to a maximum of 2500 x 2500 pixels. Using a high quality of 5000 x 5000 pixels and a 32-bit color depth, a large amount of data is generated, which may cause problems for some printer drivers. Therefore, use the high resolution with caution.
To define the image quality manually, activate the "User-Defined" option.
Color
When sending output to a monochrome printer, you can print the "Text and lines in black" instead of "Grayscale" to improve readability. Colored result diagrams and support symbols are not affected. They appear in color in the printout.
By setting the "Grayscale" option, colors are adjusted by the printer driver. Corresponding adjustment options do not exist in RSTAB.
Graphic Border
If you want to arrange the margins around the image individually, select the "Border settings" check box. Then, you can define the individual distances.
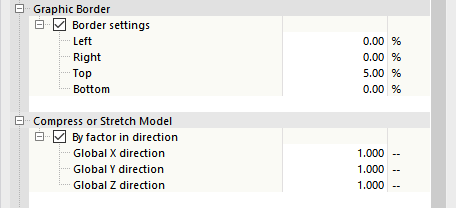
Compress or Stretch Model
If you want to show the model in a distorted way, select the "By factor in direction" check box. Then, you can compress or stretch the graphic by factors other than 1 for each global direction (see the image above). However, customizing settings in this way may only be required in exceptional cases.
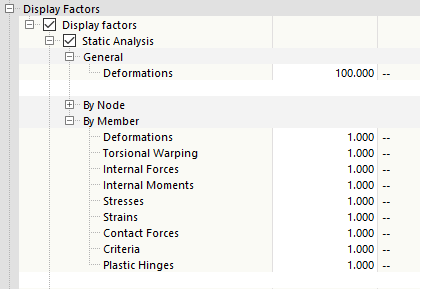
Display Factors
This category allows you to adjust the display factors for the individual result types. You can scale the results in the printout independently of the current work window, as is necessary, for example, for the final preparation of the documentation.
If selecting the "Display factors" check box, the directory opens for the results, including add-ons. Activate the "Static Analysis". Then, you can adjust the factors for each result type.
Text Size
The size of the font for dimension lines, numbering, or comments depends on the printer driver. If these texts are barely legible in the graphic printout or appear oversized, you can change the scaling factor in this directory section. It is often necessary for large-format plotting.
Symbol Size
The size of the symbols for nodes, supports, or hinges depends on the printer driver as well. If these symbols appear too small or too large in the graphic printout, you can adjust the scaling factor in this directory section. The setting is helpful for plotting.
Frame & Title Block
The graphic can be printed in the printout without a frame ("None") or it can be "Framed".
If you want to add a title block to the graphic, select the corresponding check box. RSTAB creates a standard title block, including project and model information.
In the Title Block tab, you can adjust the content and layout of the title block.
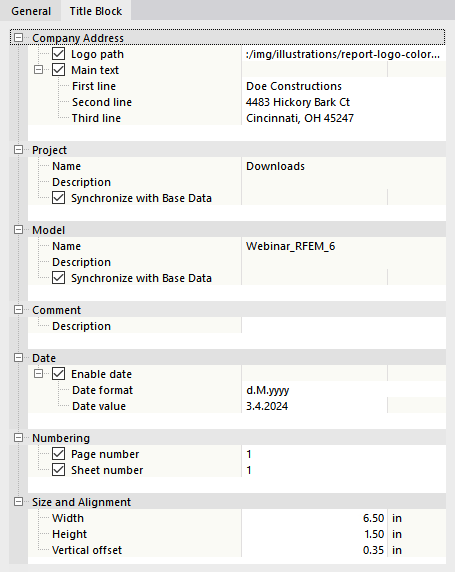
If you want to change the preset project and model descriptions, clear the "Synchronize with Base Data" check boxes. Then, the text boxes become accessible for user-defined entries.
In the "Size and Alignment" category, you can adjust the width and height of the title block. The value for "Vertical offset" describes the distance between graphic and title block.
Color Scale
This category is available when results are displayed in multiple colors. Here, you can define whether the legend of the control panel appears in the graphic printout and where it is placed, if applicable.
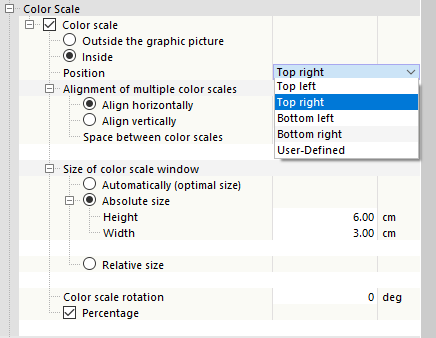
If the color scale is "Outside the graphic picture", a strip of the graphic window is detached and used for the legend. You can adjust the width of the strip under the "Size of color scale window" entry.
If the color scale is "Inside", it overlaps a part of the image. You can adjust the "Position" of the legend with the entries of the list, defining a different corner.
The "Alignment of multiple color scales" is not relevant for result graphics of the structural analysis.
The "'Size of color scale window" is automatically chosen in such a way that the legend is easy to read and the model is as little as possible covered. However, you can also specify the size in absolute dimensions or relative to the image size.
If necessary, you can set a "Color scale rotation". Use the entries in the list.
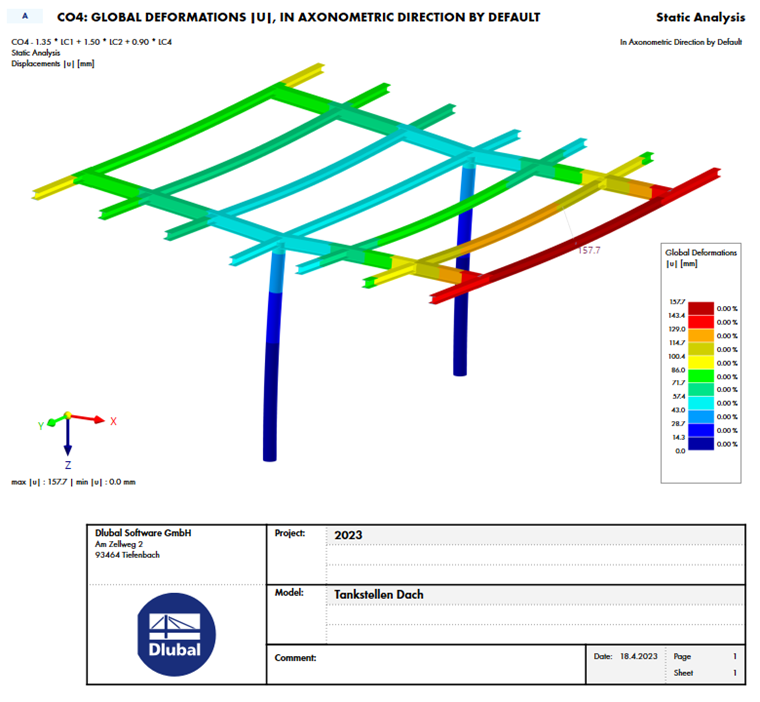
If you do not need the percentages in the legend (see the image Graphic Printout with Title Block, clear the "Percentage" check box.
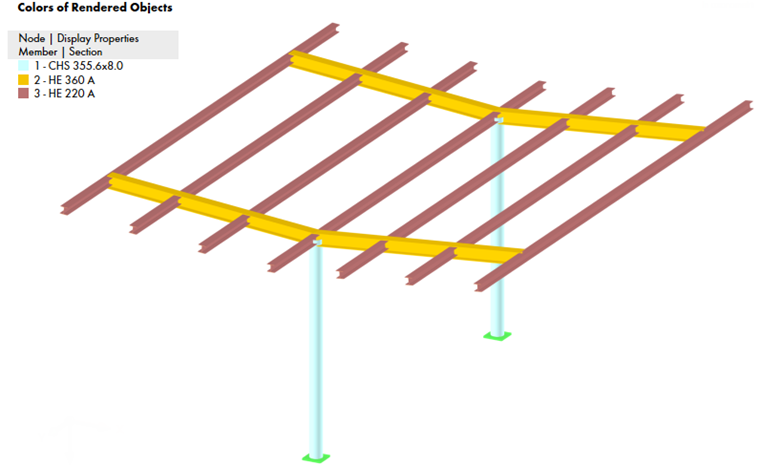
Color of Rendered Objects
The "Color panel of rendered objects" check box controls whether the legend appears in the printout for graphics with color specifications set for object properties.
Overview Image
The overview image is a small overall view of the model that appears in the graphic printout. It facilitates orientation in the case of zoomed representations. If you select the "Overview image" check box, you can define the size and position of the small window.
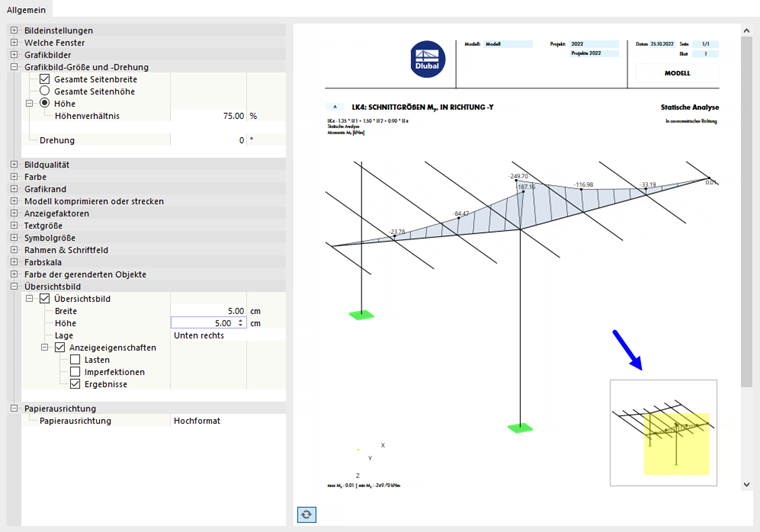
In the overview image, the area shown in the graphic printout is highlighted in color.
If you also want the overview image to display loads, imperfections, or results, select the "Display settings" check box and activate the relevant categories.