The control panel is shown when results are available in the work window. It provides various display and control options. You can display and hide the panel by clicking Control Panel in the View menu. Alternatively, use the
![]() button.
button.
The control panel consists of several tabs where you can set colors, factors, and objects for results.
Colors
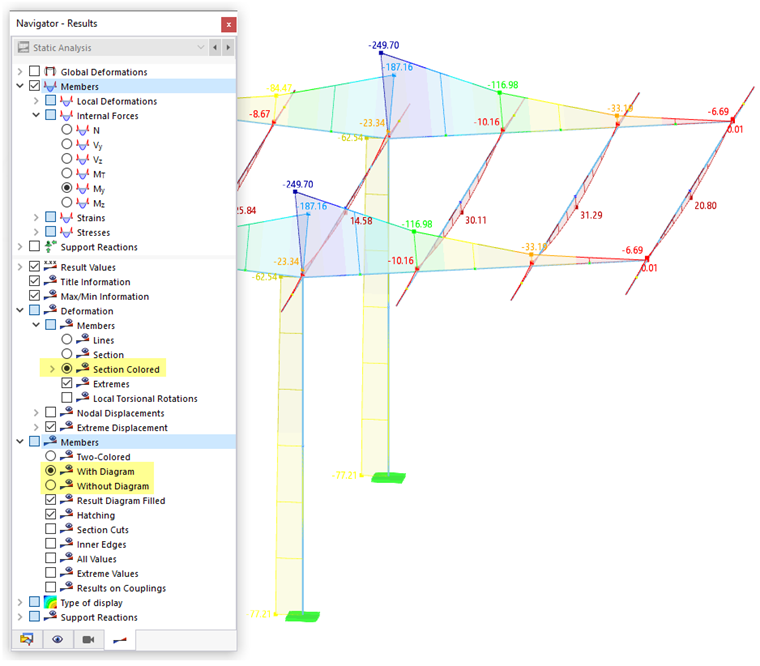
This tab is only available for a multicolored result graphic. Depending on the result type, it can be displayed by one of the following check boxes in the bottom area of the "Navigator – Results":
- Deformation: Members → Section Colored
- Members: With Diagram
- Members: Without Diagram
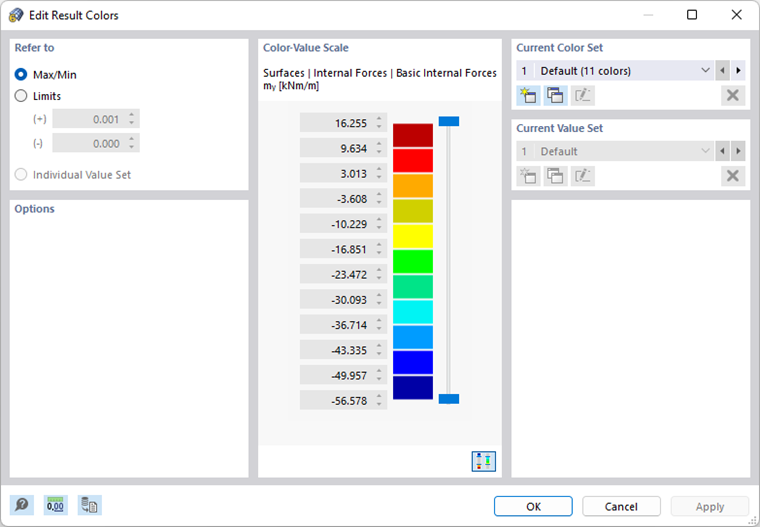
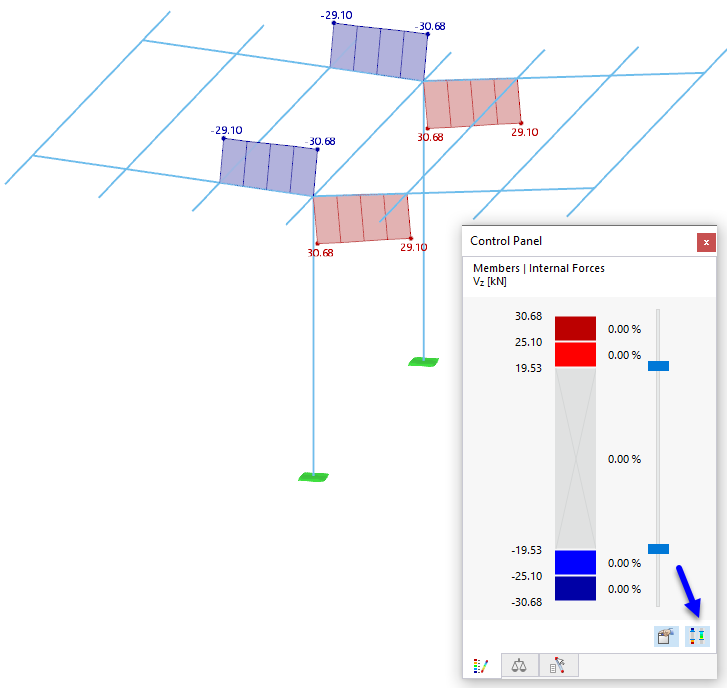
The "Colors" panel tab shows the color scale with the assigned value ranges.
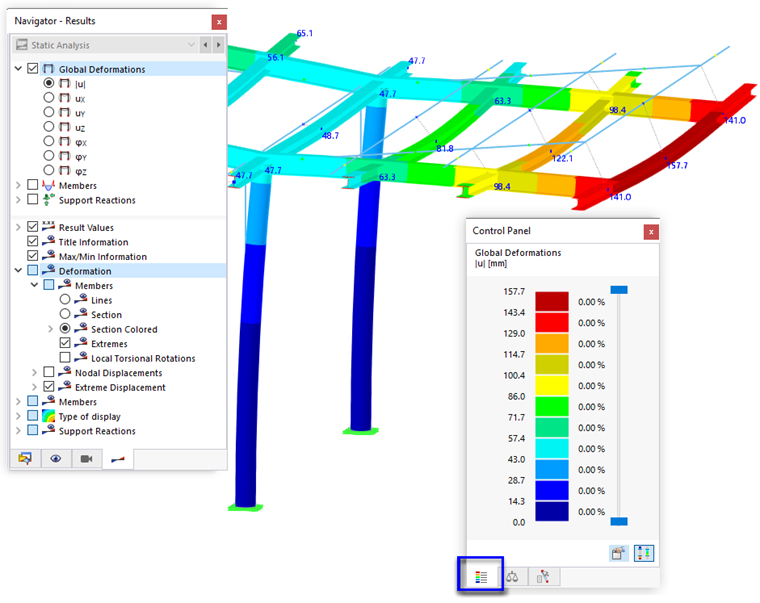
The default setting is an eleven-step color scale. It covers the area between the extreme values at equal intervals. The percentage value displayed next to a color indicates the percentage in % of the total distribution that the color range occupies.
Editing Colors
To adjust the color scale, double-click one of the colors or click the
![]() button in the panel. The "Edit Result Colors" dialog box appears.
button in the panel. The "Edit Result Colors" dialog box appears.
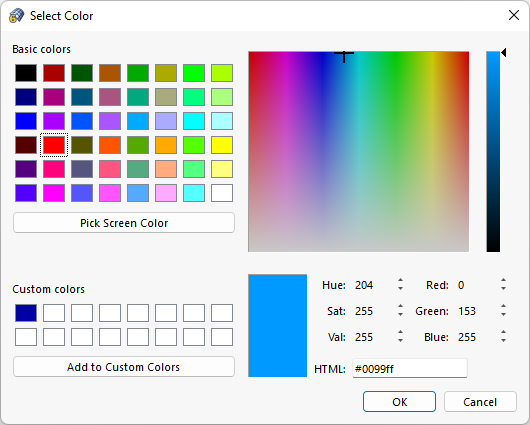
To change a color, double-click the corresponding color field. In the "Select Color" dialog box, you can adjust the color.
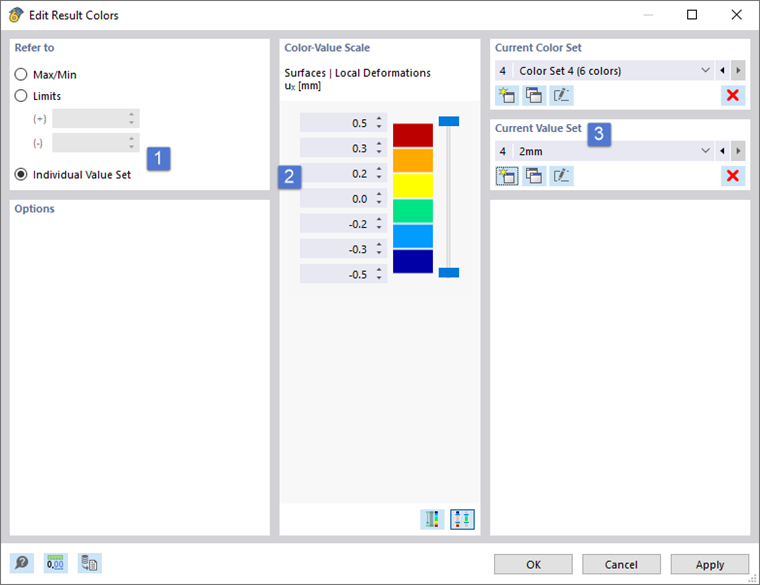
Editing Values
To edit the values assigned to the colors, double-click one of the colors or click the
![]() button in the panel. In the Edit Result Colors dialog box, activate the "Individual Value Set" (1) option. Now, you can manually define the values between the individual color ranges (2). Make sure that the values are strictly in descending order.
button in the panel. In the Edit Result Colors dialog box, activate the "Individual Value Set" (1) option. Now, you can manually define the values between the individual color ranges (2). Make sure that the values are strictly in descending order.
If you specify only the maximum and minimum values, you can use the
![]() button to create intermediate values in equally spaced intervals.
button to create intermediate values in equally spaced intervals.
The
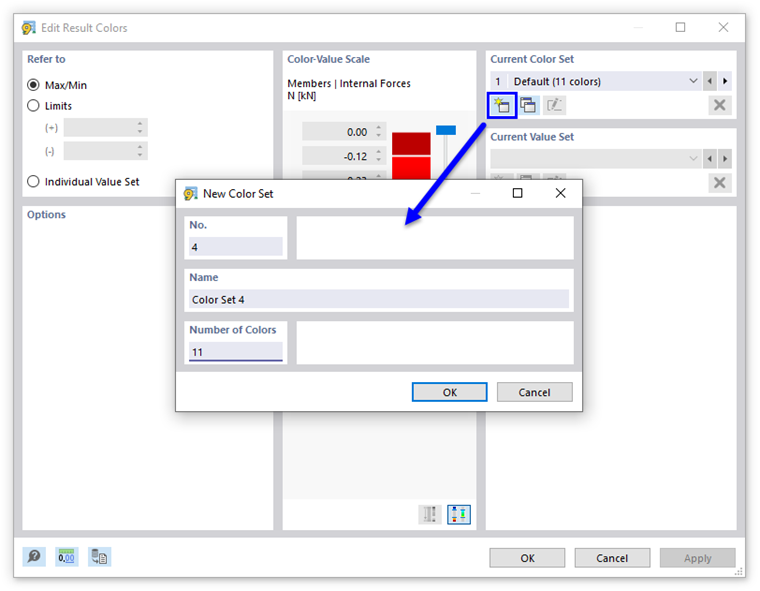
![]() button available in the "Current Value Set" dialog section allows you to create value scales (3) and to assign user-defined value ranges. This function is similar to saving a color scale (see the image Creating New Color Set). The value sets are linked to the model; they are not globally available.
button available in the "Current Value Set" dialog section allows you to create value scales (3) and to assign user-defined value ranges. This function is similar to saving a color scale (see the image Creating New Color Set). The value sets are linked to the model; they are not globally available.
Adjusting Color Ranges
To reduce the number of color ranges, use the slider next to the color scale. You can reduce the ranges from both ends.
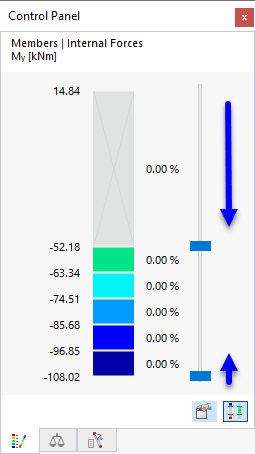
Use the
![]() button to switch between the displayed value ranges. This way, you can display only ranges with extreme values, for example.
button to switch between the displayed value ranges. This way, you can display only ranges with extreme values, for example.
The
![]() button in the "Current Color Set" dialog section allows you to create user-defined color scales and to define color ranges.
button in the "Current Color Set" dialog section allows you to create user-defined color scales and to define color ranges.
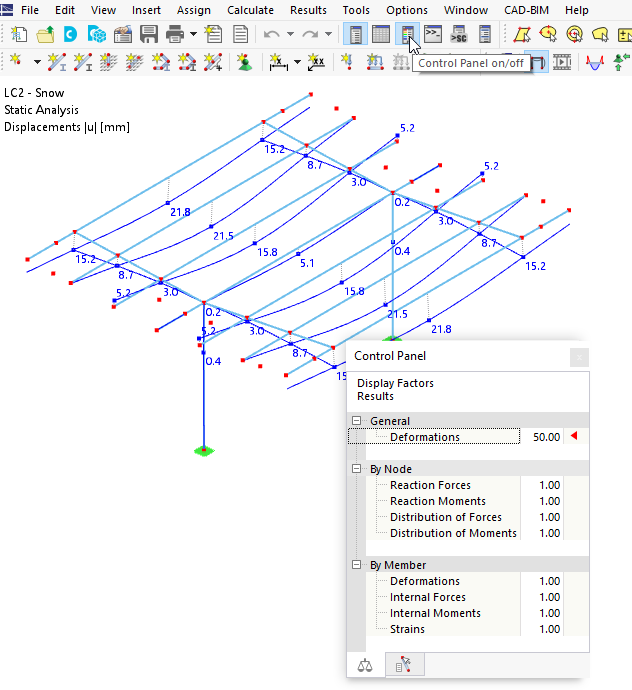
Factors
In the "Factors" tab, you can adjust the scaling factors for the graphical display.
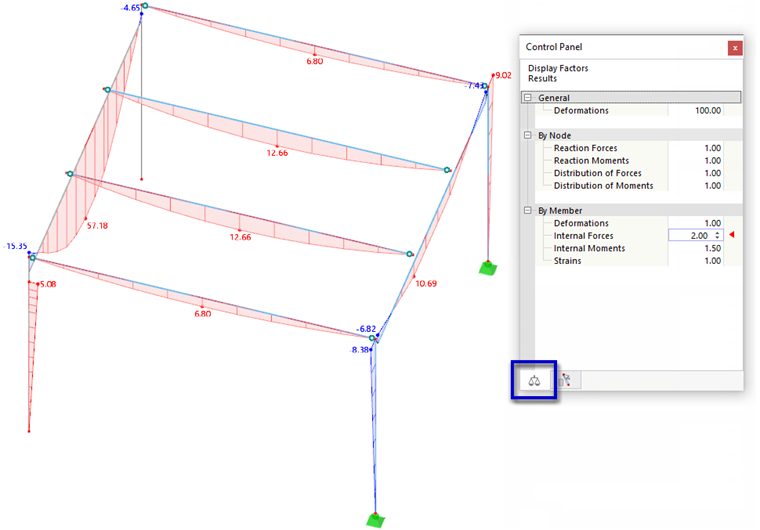
The display factors are sorted by result categories in a navigator tree. A red triangle marks the input field for the current result graphic.
Objects
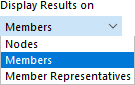
The "Objects" tab controls the results displayed for specific nodes or members.
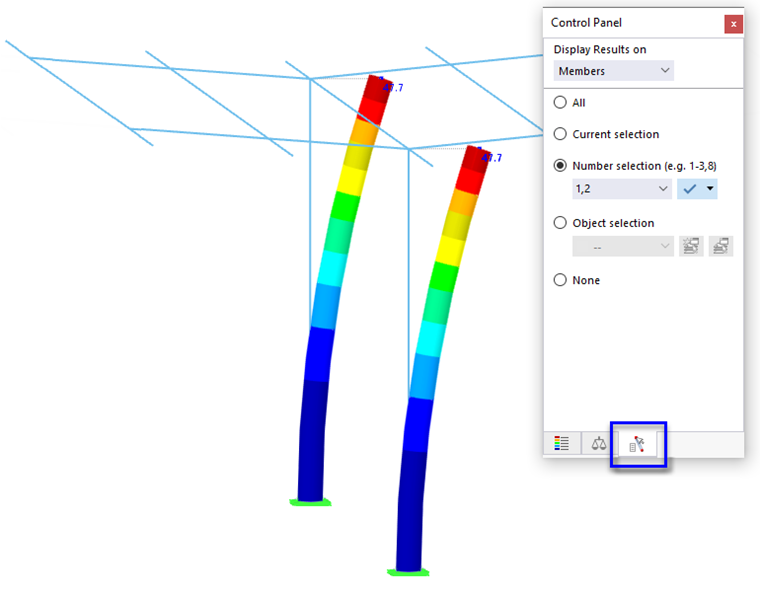
In the "Display Results on" list, select the object type whose results you want to isolate.
Now, use the check boxes to control which objects are displayed with results.
- All: The results of all objects are displayed.
- Current selection: The results of the objects that you select in the work window are displayed.
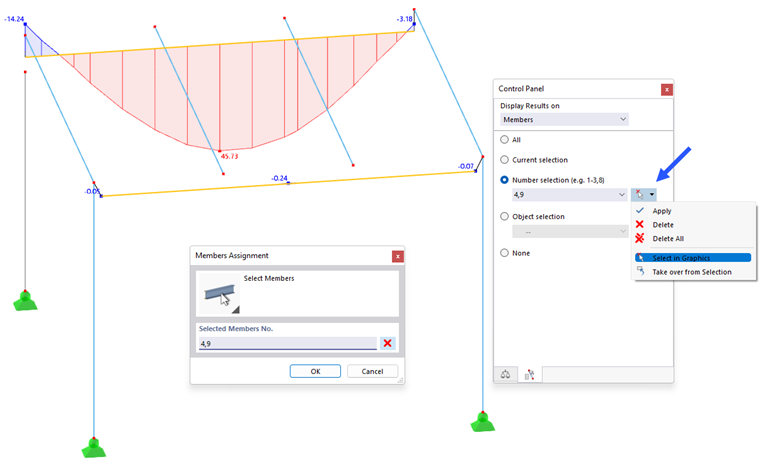
- Number selection: The results of the objects whose numbers are specified in the input field are displayed. You can also select the objects graphically (see the image Determining Member Numbers Graphically).
- Object selection: The results for objects of an object selection (OS) are displayed. Select the object selection in the list, or create a new OS with the
 button.
- None: Results are not displayed for any object of the specified type.
To transfer the objects from the graphic when selecting the "Number selection", open the list button next to the input text box. Click Select in Graphics, then select the relevant objects in the work window.