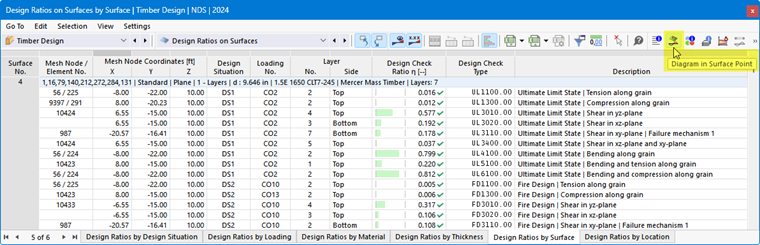
The result diagrams in the surface point represent the results in the surface cross-section. To access this display, click the
 button. It is available in the result tables of the “Timber Design” category for surface objects.
The “Result Diagrams in Surface Point” window appears.
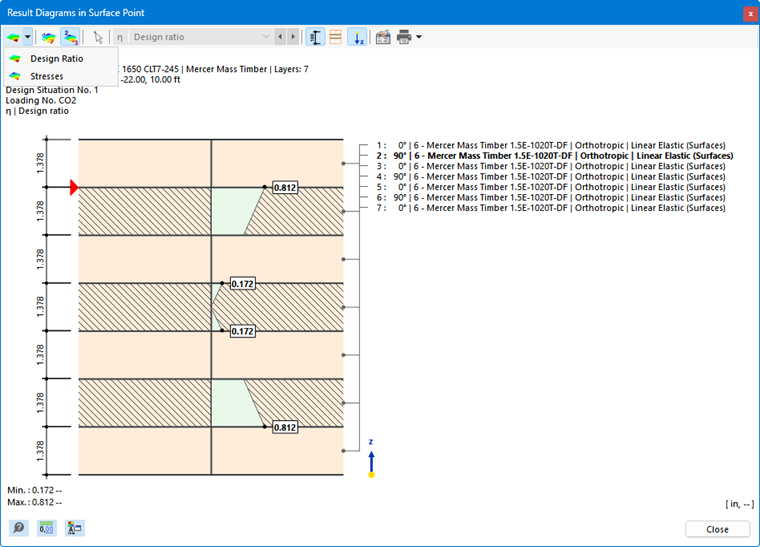
The graphic shows the design ratios in the stress or limit of failure states corresponding to the result of the current table row. Depending on the settings in the Global Settings dialog box, these are the results for the mesh node or grid point. They are displayed as linear distributions on the surface or in the layers, based on the results from the surface sides (top, bottom, center).
You can customize the graphic using the buttons in the toolbar. They are assigned the following functions:
| Button | Feature |
|---|---|

|
List button with the selection options for result types |

|
Show or hide the surface side values |

|
Show only the extreme values of positive and negative results |

|
Show or hide the dimensions |

|
Show or hide the layers |

|
Show or hide the local z-axis |

|
Open the “Edit Thickness” dialog box |

|
Print the current display |
Result Types
Use the
list button to select which result type should be displayed in the surface section. There are two options you can select (see the image Result Diagrams in Surface Point):
- Design ratios
- Stresses
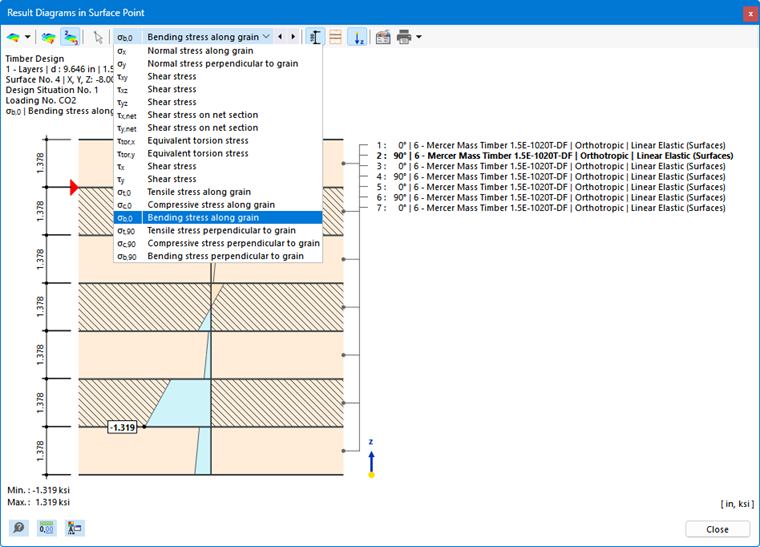
For stresses, you can use the menu bar list to specify the stress type whose distributions you want to examine.
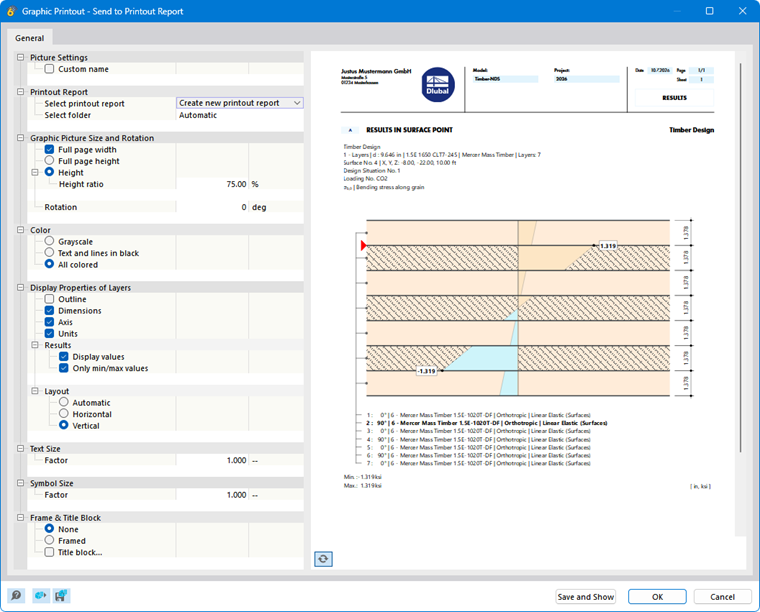
Graphic Printout
Using the
list button, you can print the current graph directly, save it as a PDF, or add it to a printout report. You can also specify the details to be displayed in the print preview.