


The Result Diagrams in Cross-Section display the results at the stress points of the cross-section. To access this representation, click the
![]() button. It is available in the result tables of the 'Steel Design' category for member objects, but not for surfaces.
button. It is available in the result tables of the 'Steel Design' category for member objects, but not for surfaces.

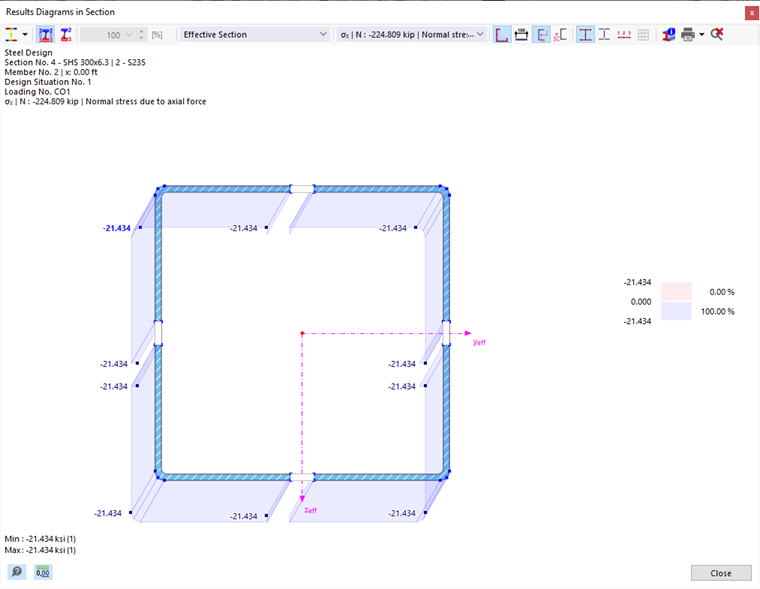
The 'Result Diagrams in Cross-Section' window appears. The graphic shows the stress condition that exists for the result of the current table row.

You can control the graphic with the mouse as usual, for example, to zoom. The functions are described in the chapter Graphic Control of the RFEM manual.
The result representation can also be adjusted using the buttons in the toolbar. They are assigned the following functions:
| Button | Function |
|---|---|
|
|
List button with selection option for Result types |
|
|
Shows and hides the values at the stress points |
|
|
Shows only the extreme values of positive and negative results |
|
|
Allows scaling the result diagrams using a factor in [%] |
|
|
Shows and hides the cross-section contour |
|
|
Shows and hides the dimensioning |
|
|
Shows and hides the axis system |
|
|
Shows and hides the shear center |
|
|
Shows and hides the stress points |
|
|
Shows and hides the c/t-parts (single panels) |
|
|
Shows and hides the numbering of stress points |
|
|
Shows and hides the FE mesh |
|
|
Opens the 'Cross-Section Information' window |
|
|
Allows printing the current representation |
|
|
Displays the overall view of the result diagrams |
Result Types
Using the list button
![]() , you can select which results are to be displayed on the cross-section. Depending on the design, the following options are available:
, you can select which results are to be displayed on the cross-section. Depending on the design, the following options are available:
- Utilization diagram
- Stresses
- Unit stresses
- Strains
- Unit strains

Depending on the existing stress, you can display various results on the cross-section. Use the selection options in the menu bar for this.

The designation TWA stands for a result from a thin-walled cross-section calculation, FEM for a cross-section calculation with finite elements. The method defined for the respective cross-section is used for the design (see chapter Cross-Sections).
The addition FSM for buckling modes denotes results based on the finite strip method (see technical article Linear Buckling Analysis with Finite Strip Method).
Results of the finite element calculation are always displayed as color gradients directly on the cross-section. Results of the thin-walled analysis, as well as the utilization, however, are plotted as diagrams at the stress points.
Elastic Stress Distribution
When displaying the stresses for the internal forces present in the relevant design, note that the stresses are always calculated with an elastic distribution. Therefore, for a plastic cross-section design, the displayed stresses merely represent additional information and are not used for the design. A plastic stress distribution in the cross-section cannot currently be calculated.
Stresses on Effective Cross-Section
If the stress determination for the selected design is performed on the effective cross-section (for example, for cross-section class 4 in Eurocode 3), you can distinguish between the display of stresses on the effective cross-section and on the gross cross-section in the selection list.
Graphic Printout
With the options of the list button
![]() , you can directly print the current graphic, save it as a PDF, or transfer it to the printout report. The details to be displayed can also be defined in the print preview.
, you can directly print the current graphic, save it as a PDF, or transfer it to the printout report. The details to be displayed can also be defined in the print preview.
