


The result diagrams of members are also available for the timber design results. They allow you to evaluate the design checks in diagrams, just as you are used to doing with the results of the structural analysis.
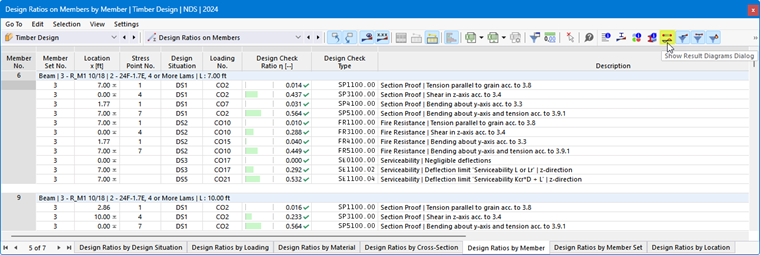
The result diagrams can be accessed as described in the chapter Result Diagrams of the RFEM manual. You can also use the
 button, which is available in the result tables of the “Timber Design” category for member objects.
The “Result Diagrams” dialog box appears. The “Timber Design” result category is preselected.
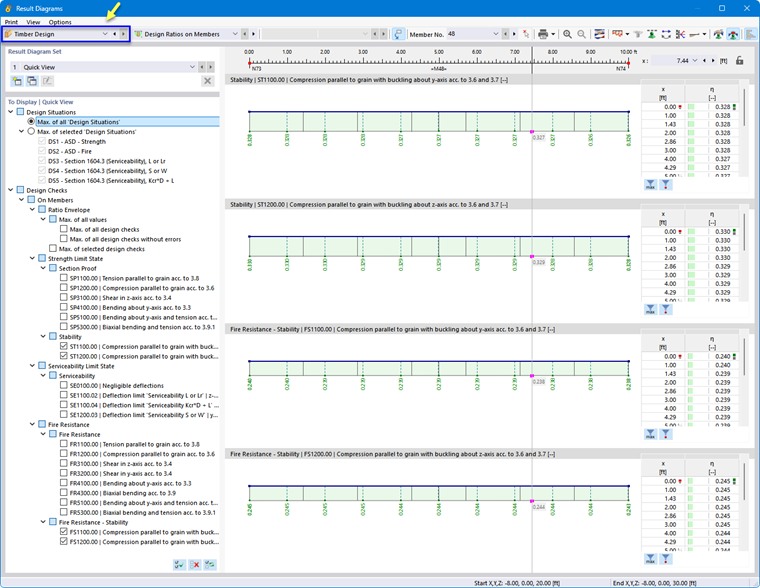
In the “To Display | Quick View” section, specify the design checks whose distributions are to be displayed in graphs. The selection options for member distributions correspond to those in the “Navigator – Results” (see the image Displaying Multiple Result Types). Each result type is displayed in a separate graph.
If you want to check the results for a different member, select it from the “Member No.” list or use the
 button for graphical selection.
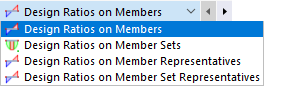
In the “Design Ratios on Members” list, you can also select a different object type.
Additional options are described in the chapter Result Diagrams of the RFEM manual.