


You can evaluate the result diagrams of members, lines, line supports, or result sections in diagrams. First, select the object in the work window. Hold down the Ctrl key to perform multiple selection. Then, open the result diagrams using one of the following options:
- Menu "Results" → "Result Diagrams for Selected [Objects]"
- Function "Result Diagrams" in the shortcut menu
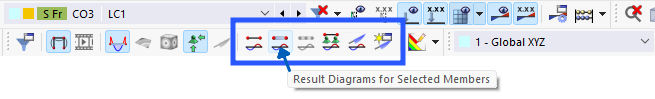
- Button "Result Diagrams"
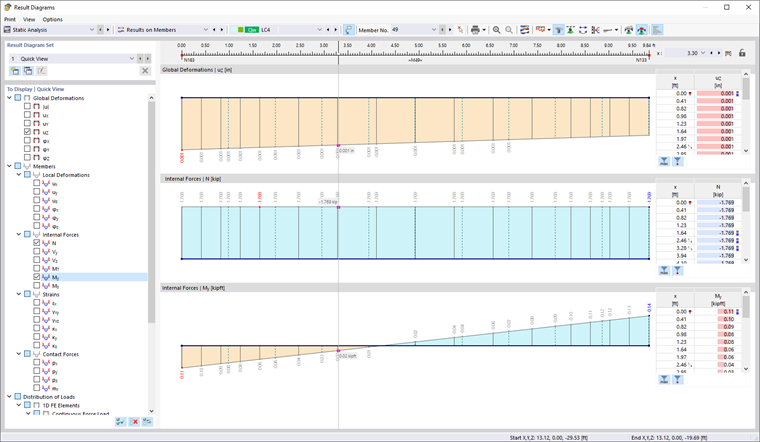
The "Result Diagrams" dialog box appears.
Toolbar
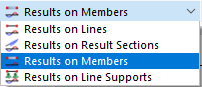
The selected object type is set in the "Results on [Object]" list. You can also select a different type.
In the list of load cases and combinations, you can switch between the individual results.
The numbers of the selected objects are displayed for members and lines. If you want to check the results of another object, select its number in the list or use the
![]() button for graphical selection.
button for graphical selection.
The buttons have the following functions:
|
|
Synchronize diagrams with the result types activated in the navigator (relevant for several result diagram sets) |
|
|
Print current result diagrams |
|
|
Increase result diagrams |
|
|
Decrease result diagrams |
|
|
Open the Display Properties dialog box for display adjustments |
|
|
Control the display for result diagrams of several objects |
|
|
Show member results with or without a rib component |
|
|
Show or hide result diagram above the column area |
|
|
Reverse the direction of a result diagram |
|
|
Show or hide the ordinates with maximum values |
|
|
Show the actual result diagram or smoothed results (list button) |
|
|
Open the Smooth Ranges of Result Diagrams dialog box |
|
|
Show or hide smooth ranges |
|
|
Show or hide colored relation scales for table values |
Result Diagram Set
The window section on the top left allows for saving diagrams. The "Quick View" with selected results is preset.
To save the current diagram settings, click the
![]() button. Enter a description in the "New Result Diagram Set" dialog box.
button. Enter a description in the "New Result Diagram Set" dialog box.
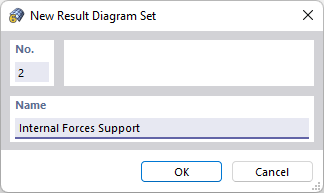
After clicking OK, the result diagrams are available as "Result Diagram Set" in the list.
The
![]() button controls the result types that are displayed when switching between the result diagram sets: If it is activated (default), the originally saved diagrams appear. If you deactivate the function, the current navigator categories are applied to the other diagrams.
button controls the result types that are displayed when switching between the result diagram sets: If it is activated (default), the originally saved diagrams appear. If you deactivate the function, the current navigator categories are applied to the other diagrams.
Navigator
In the navigator, select the result types that you want to evaluate in the diagram. Depending on the object type, you can select deformations, internal forces, stresses, strains, or support forces. Each result type is represented in a separate diagram.
Diagrams
In the main area of the window, you can see the diagrams of the selected result types. You can adjust the display size with the
![]() and
and
![]() buttons. For lines delimiting two surfaces from one another, surface results are displayed for both sides.
buttons. For lines delimiting two surfaces from one another, surface results are displayed for both sides.
When moving the mouse along the line or member, the "moving" result values of the respective x-location are displayed. The location "x" refers to the line or member start; it is shown in the upper right corner of the window. You can also enter an x-location in the text box. To lock the pointer at the defined location, click the
![]() button.
button.
If diagrams of several objects are displayed, you can set the presentation with the
![]() list button. Different options are available for selection.
list button. Different options are available for selection.
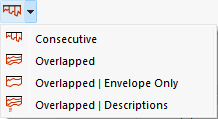
The following image shows the My moments of three members in an overlapped display.
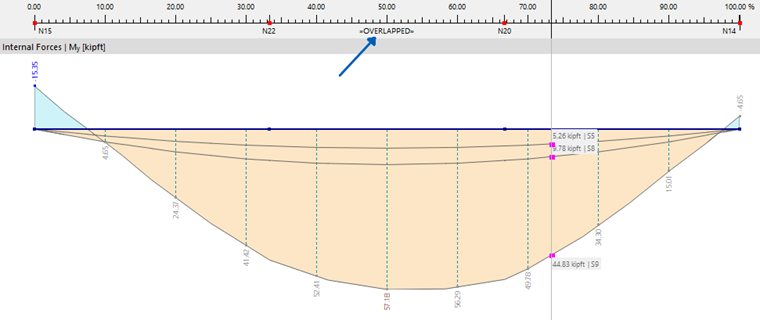
The "Overlapped | Envelope Only" option allows you to omit the gray lines and values in the diagram.
The results are listed in tabular form on the right. These are the results available on edge nodes and on locations of extreme values and division points. The latter correspond to the FE mesh nodes or member divisions according to the specification entered in the Mesh Settings dialog box.
You can filter the results by using the buttons below the tables.
|
|
Show extreme values only |
|
|
Show values of ends only |
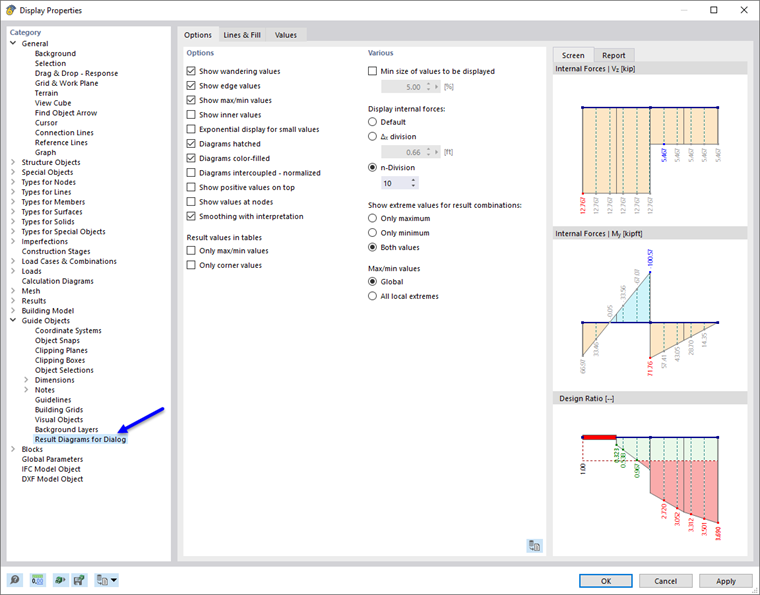
Display Properties
To adjust the display of the result diagrams, click the
![]() button in the toolbar. The "Display Properties" dialog box allows you to customize colors, lines, and values.
button in the toolbar. The "Display Properties" dialog box allows you to customize colors, lines, and values.
Smooth Ranges for Result Diagrams
You can average the result values by means of user-defined "Smooth Ranges" in order to prepare results for engineering purposes. This way, you can reduce the moment peaks above supports, for example.
Click the
![]() button in the toolbar to open the "Smooth Ranges of Result Diagrams" dialog box.
button in the toolbar to open the "Smooth Ranges of Result Diagrams" dialog box.
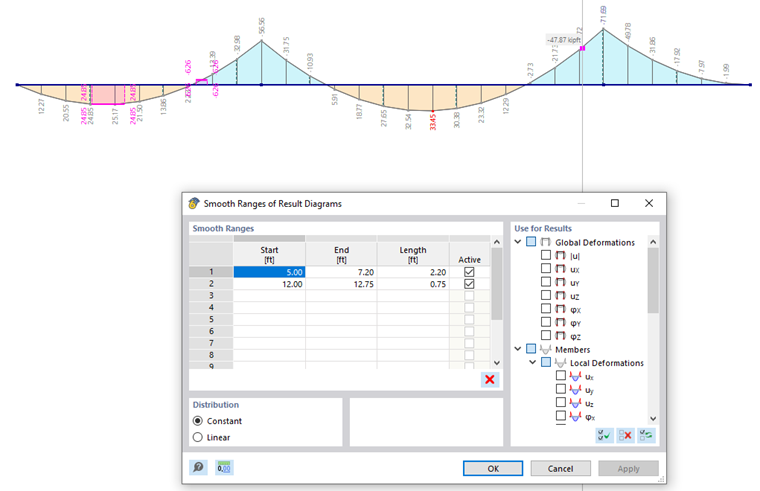
In the "Smooth Ranges" table, define the zones whose average values you want to determine. The entries for start, end, and length are interactive. Use the "Active" check box to control which area is considered in the diagram.
In the "Use for Results" dialog section, select the deformations, internal forces, stresses, or strains for which the results should be smoothed.
In the "Distribution" dialog section, you can control whether the values in the smooth range are displayed with a constant (as shown in the image above) or linear distribution.