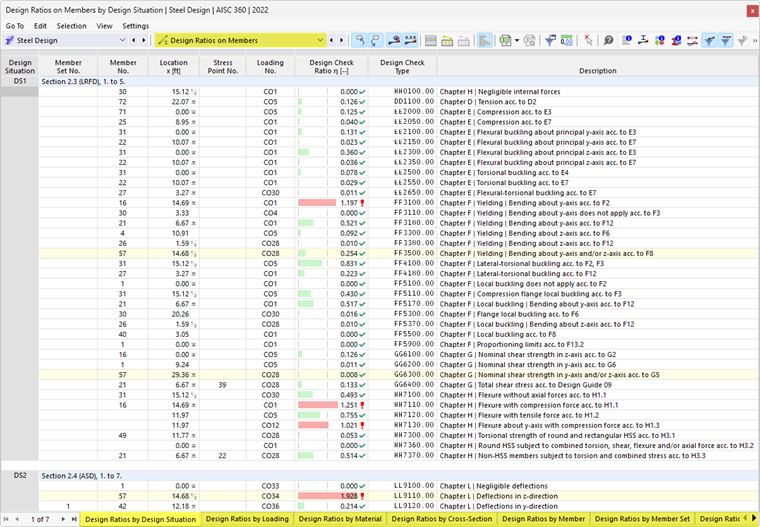
The result tables of the Design Ratios on Members category contain the result data for the design checks carried out with the respective design ratios.
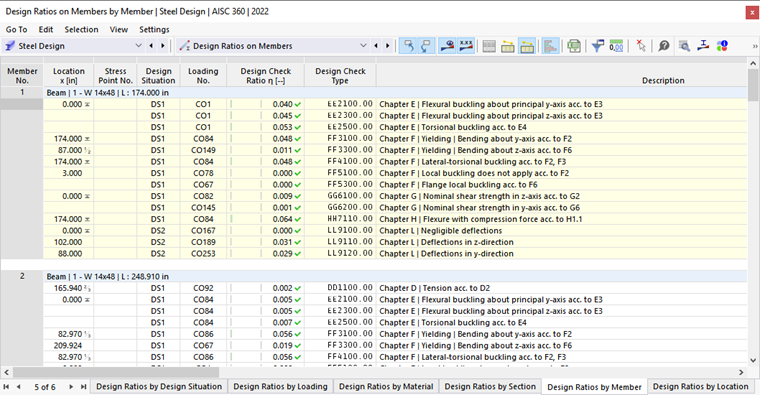
The member results are sorted in the tabs according to the following criteria:
- Loads (design situations, load combinations)
- Member properties (materials, cross-sections)
- Objects (member sets, members, member locations x)
Member Set No. / Member No.
For each design criterion, the number of the member set (if designed) and the member with the highest design ratio is specified.
Location x
The x-location in the member for which the maximum design ratio was determined is specified. The following locations x are relevant for the output in tables:
- Start and end nodes
- Member result intermediate points (if defined)
- Member division according to the mesh settings for members
- Extreme values of internal forces
Stress Point No.
The design is based on the stress points of the cross-section. These points are defined by the centroidal distances, static moments, and thicknesses of the cross-section members. All standard cross-sections in the library, as well as the RSECTION cross-sections, are provided with stress points at the locations relevant to the design.
You can check the stress points in the cross-section information dialog box. To do this, click the
 button in the table toolbar. In the “Stress Points” tab of the information dialog box, the stress points are listed with their coordinates and displayed on the cross-section (see the section Stress Points in the RFEM manual).
Design Situation
This column names the numbers of the design situations for which the individual design ratios are available.
Loading
The numbers of the load or result combinations that are governing for the respective design checks are specified.
Design Criterion
The design conditions according to standard are specified in this column. The degree of the respective design ratio is expressed by the length of the colored bar.
Type of Design
Each design is designated by an identifier with a number. For example, the cross-section checks according to Eurocode have the identifier “SP”, the stability analyses have the identifier “ST”, and the serviceability design checks have the identifier “SE”. The type of design is explained in the Description column.
Design Check Formula
You can activate this column in the result table manager. It specifies the equations of the standard according to which the design checks are carried out.
Description
Each design check is explained by a short description with reference to the chapter in the standard.
The design check details for a specific design ratio can be displayed by clicking the
 button or by double-clicking on the line.
Filtering Results by Limit State
If only the results for certain limit states or types of design are to be displayed in the table, set the corresponding filters in the result table manager. For example, you can only display the results for the stability analyses by deactivating all “Rows” with the exception of “Stability”.
The buttons in the table toolbar also provide the option to quickly show and hide the results of certain limit states. They are accessible if design checks for the corresponding limit states are available.

|
Show or hide results for the ultimate limit state |

|
Show or hide results for the serviceability limit state |

|
Show or hide results of fire resistance design checks |

|
Show or hide results of seismic design checks |
Filtering Results by Design Ratio
The list on the right of the table toolbar provides the option of filtering the tables by design ratio. With the Max option, only the governing design is output for each object.
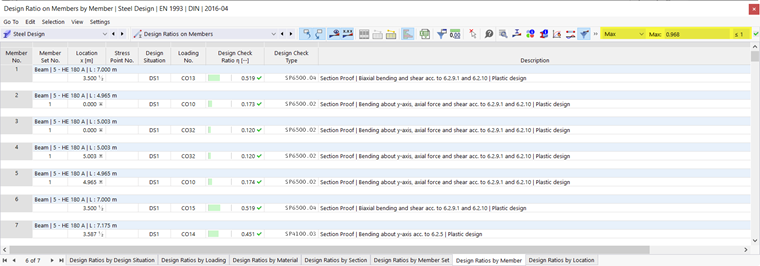
You can also use a user-defined filter criterion. To do this, use the “Define” option in the list. The Result Table Manager dialog box opens with the “Criteria – Values” tab. Define the condition—for example, to display only design ratios that are greater than a certain value.
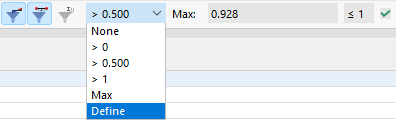
The chapter Filter Result Tables of the RFEM manual describes how to define conditions for the table values.
Optimizing Cross-Section
If the design checks for a cross-section are not fulfilled, you can have the program optimize the cross-section. The program searches for the smallest possible cross-section within the same cross-section series that fulfills the requirements. Proceed as follows:
- Set the Input data table category for the steel design.
- Switch to the Sections table.
- Click in the corresponding cell of the table column Use Other Section for Design.
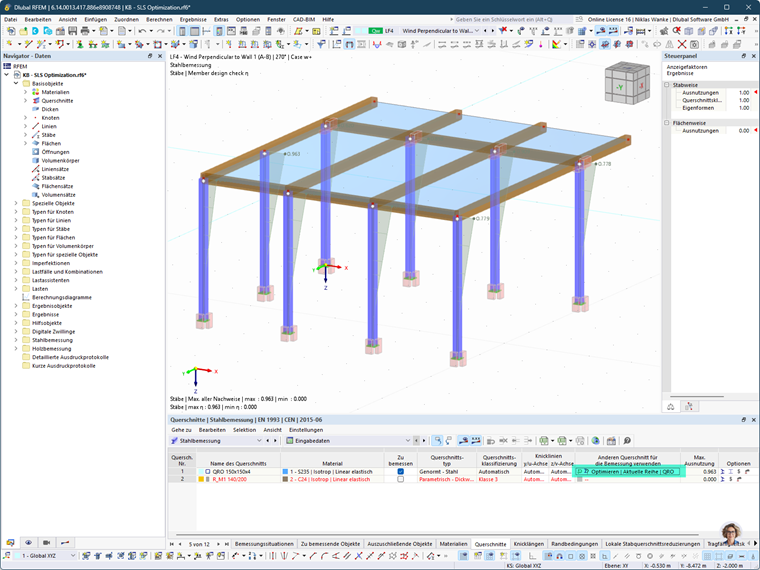
- Open the list and select the Optimize option (see the image Optimizing Cross-Section).