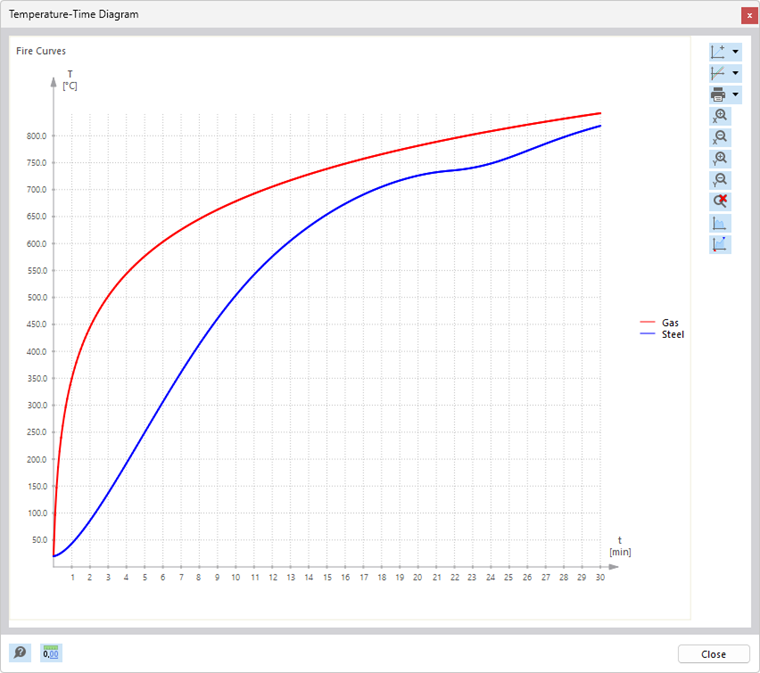
For fire resistance design checks, you can calculate the steel temperature that is governing at the time of design. The essential parameters with the applied temperature curve are defined in the Fire Resistance Configurations. After the design, you can display the temperature distributions of gas and steel in the Temperature-Time Diagram. To open this window, click the
 button in the toolbar of the Design Ratios table or in the Design Check Details dialog box.
If a fire resistance design is selected in the table or in the design check details, the fire curves are displayed in the “Temperature-Time Diagram” window.
Use the list button
 to change the ordinate and abscissa or switch from a linear to a logarithmic scale.
Printing Diagram
Use the list button
 to print the diagram directly, save it as a PDF, or transfer it to the printout report. It will be updated automatically there if you perform a new design using different input data.
Changing Layout
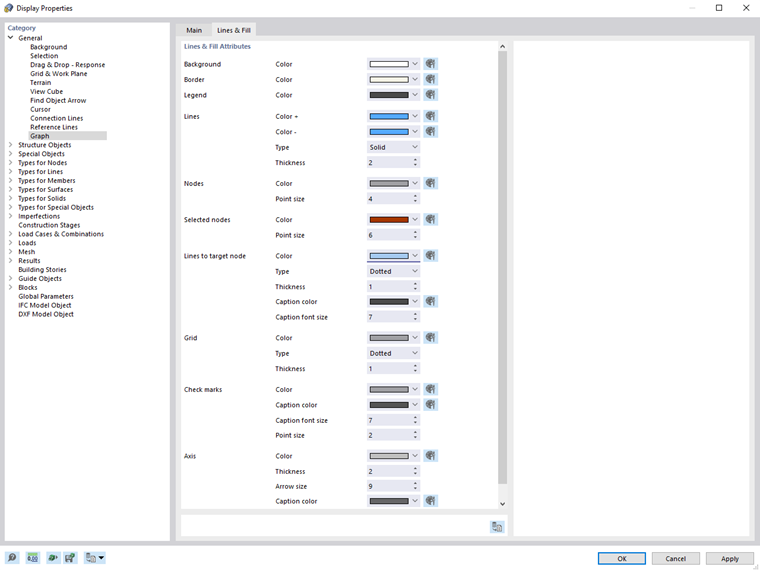
If you want to change the colors and font sizes of the diagram, right-click the diagram surface. In the shortcut menu that contains various options for customizing the diagram, select the Diagram Settings entry. You can then make the changes in the ‘‘Display Properties’’ dialog box.