


A response spectrum represents maximum system responses for a group of single-mass oscillators (EMS) to a particular system excitation, such as mean value of several seismic records. The EMS have the same damping properties, but different natural periods. The maximum system responses of the individual EMS are shown versus the natural period of the EMS; this graphic is the response spectrum.
The response spectrum method has great advantages in terms of calculation time. It is also a common method specified in various building standards. Please note, however, that this is an approximation method to determine the maximum internal forces of the model. For detailed information on the response spectrum method, see Wilson [1] or Tedesco [2], for example.
For the analysis, a multimodal response spectrum method is available. You can apply the relevant spectra in compliance with the standards or create them as user-defined. The spectra used in the model are managed in the Response Spectrum dialog box.

Main
In the Main tab, you can specify the type of response spectrum and define the parameters.
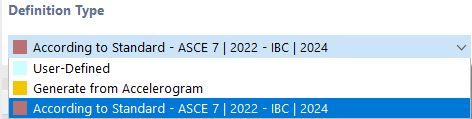
Definition Type
Specify how you want to define the response spectrum. There are four definition types available in the list.
User-Defined
When selecting a user-defined response spectrum, you can specify the properties in the "Periods & Accelerations" section: Enter the periods T or frequencies f with the associated accelerations Sa line by line in the table.

Using the table, you can individually define the Acceleration – Period Diagram or Acceleration – Frequency Diagram. The order of the lines entered can be arbitrary. This allows you to subsequently add value pairs that lie between the values that have already been defined.
Since there must be a consistent response spectrum, the values are displayed in red if they are in the incorrect order. In this case, use the
![]() button to sort the lines in ascending order.
button to sort the lines in ascending order.

You can delete the selected table row using the
![]() button.
button.
The
![]() button allows you to import the table values of a diagram from Excel. You can use the
button allows you to import the table values of a diagram from Excel. You can use the
![]() button to export the user-defined response spectrum to Excel.
button to export the user-defined response spectrum to Excel.
The functions for saving user-defined spectra in a library and reading them back in from there are still under development. The buttons
![]() are thus blocked.
are thus blocked.
If the value pairs have a constant time step between them, activate the ΔT check box below the table. Then, enter the periodic step in the text box next to it
![]() . If you now enter accelerations in the table, the time is automatically set with the steps ΔT. You can adjust the step ΔT at any time in order to enter further value pairs with a different time step. This function is described in the chapter
Accelerograms
.
. If you now enter accelerations in the table, the time is automatically set with the steps ΔT. You can adjust the step ΔT at any time in order to enter further value pairs with a different time step. This function is described in the chapter
Accelerograms
.
User-Defined with g-Factor
This option allows you to manually define the table values of a response spectrum as described in the User-Defined section. Enter the values of the periods T or frequencies f with the associated accelerations Sa in the "Periods and Accelerations" table.

The acceleration is without any dimensions: Each value entered is multiplied by the g-factor that is stored in the base data of the model (default setting: g = 10 m/s²). If necessary, you can adjust the value of the gravitational acceleration in the Settings and Options tab.
Generate from Accelerogram
You can generate the response spectrum from one of the accelerograms that have been defined for the model, or create a new one in this dialog box.

Select the accelerogram from the list. Click the
![]() button to check the parameters of the selected accelerogram and adjust them, if necessary. Use the
button to check the parameters of the selected accelerogram and adjust them, if necessary. Use the
![]() button to create a new accelerogram according to user-defined criteria or import the recorded earthquakes from a
library
.
button to create a new accelerogram according to user-defined criteria or import the recorded earthquakes from a
library
.
In the list, select the "Direction" of the global axis in which the response spectrum should be applied. Accelerograms can have different acceleration – period diagrams, depending on the direction.

Use the other options to adjust the "Conversion Parameters" used for generating the response spectrum from the accelerogram. After each change, the response spectrum is updated in the diagram. In the "Table Values" tab, you can check the values of the period T and the acceleration Sa.
- The viscous "Damping" D is the damping of the group of single-mass oscillators (EMS) for which the maximum system responses are calculated. The higher the viscous damping is set, the smaller are the generated accelerations.
- The "Interval" describes the duration between the minimum time Tmin as the period of the first EMS and the maximum time Tmax as the period of the last EMS, which is applied when generating the response spectrum.
- The "Sample Count" represents the number of steps between the minimum and the maximum time (period). You can use this value to influence the number of the generated data points. The sample count also affects how finely the underlying accelerogram is approximated.
According to Standard
You can generate a response spectrum from the parameters specified in a standard. The standard defined in the Standards I tab in the model's base data is preset.

If you change the standard in the base data, the parameters and standard values adapt to the specifications of the standard.
Provided the geographical position of the building object has been specified in the model parameters, the accelerations of the corresponding location apply.
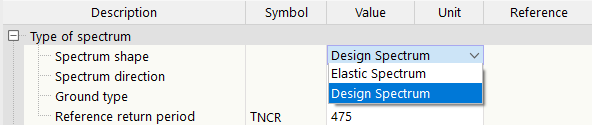
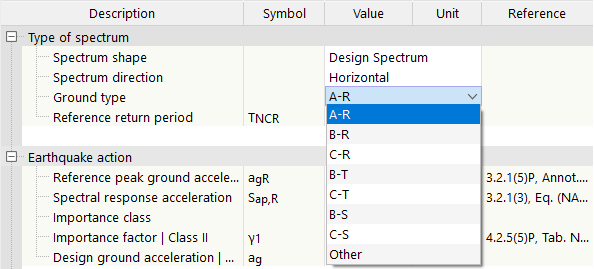
You can select the parameters in the lists or define them manually, depending on the parameter type and the standard. Many standards differentiate between a linear design spectrum using a ductility coefficient q and an elastic response spectrum using a coefficient for the damping η. Use the list to determine the "Spectrum shape".
The "Spectrum direction" controls whether to apply a horizontal or a vertical response spectrum.
In some cells, there are fixed parameters. For example, according to EN 1998‑1 CEN, the parameters S, TB, TC, and TD are determined from the subsoil classes A to E; the values cannot be changed. If you still want to adjust these parameters, enter the Other ground type. This option is available for several standards. It enables the associated parameters.
Diagram
The diagram of the response spectrum generated from the specifications is shown in the lower section. The functions of the diagram are described in the chapter Response Spectrum .
Table Values
The Table Values tab is only available if the response spectrum is generated using the Generate from Accelerogram definition type.

In this tab, you can check the values of the periods T with the associated frequencies f and accelerations Sa. Thus, the table corresponds to the input of a response spectrum described in the User-Defined section. However, it is not possible to edit the values in this table.