


After a successful calculation, the results of the modal analysis load case are displayed: You can see the first mode shape in the work window; the eigenvalues and natural frequencies of the individual mode shapes are in the table. The dynamic analysis results are thus fully integrated into the program interface of RFEM or RSTAB.
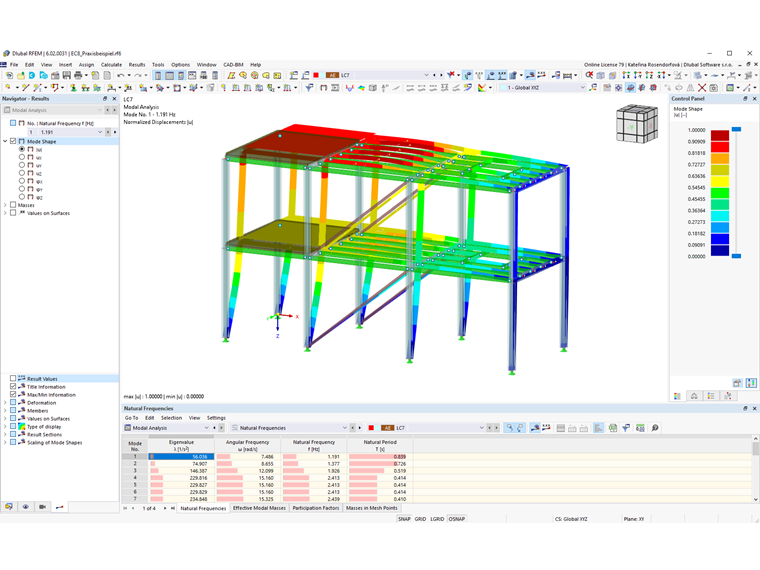
Work Window
Select a mode shape whose results should be graphically displayed from the list at the top of the "Navigator – Results". You can also use the buttons
![]() and
and
![]() to switch between the individual mode shapes.
to switch between the individual mode shapes.
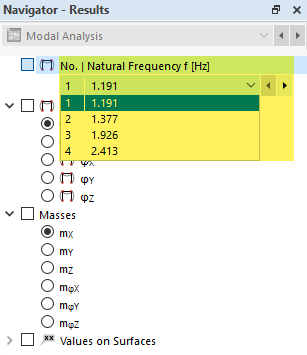
The following result types are available for the graphic display in the Navigator:
- Mode Shape: absolute total displacement; normalized displacement in uX, uY, or uZ; normalized rotation in φX, φY, or φZ
- Masses: translational components of the displacements uX, uY, or uZ; rotational components of the rotations φX, φY, or φZ
- Values on Surfaces
Table
The result tables of the dynamic analysis are displayed automatically when displaying the results of a dynamic load case. You can use the categories and subcategories to control the display of the results in the table (see the chapter Tables of the RFEM Manual). Various subcategories are available for the modal analysis, which are presented in the following chapters.
