


The tables are at the bottom edge of the work window. They manage the model, load, and result data in numerical form.
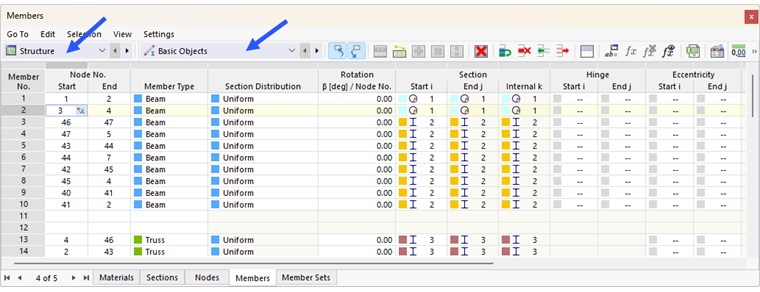
The table content can be controlled using categories, including individual subcategories. First, define the category on the left in the table toolbar. The list provides various entries for structural, load, and result data.
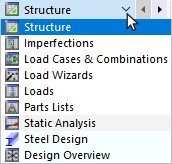
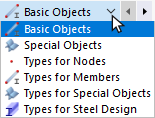
Then, select the subcategory in the list to the right. Each category is divided into specific entries.
You can now navigate to the individual tables using the tabs.
When you "grab" the tables with the pointer in their title bar, you can move them into the workspace. Double-clicking the title bar or moving it to the edge docks it back to the window frame.
An object whose row is selected in the table is also selected in the work window. This allows you to quickly locate and edit objects. You can switch this synchronization between tables and graphics on and off using the
![]() and
and
![]() buttons in the table toolbar.
buttons in the table toolbar.
Colors
The table entries are usually displayed in black. If an object is defined incorrectly, it appears in red. However, if an empty cell is marked in red, this cell is referenced by another object, but has no content.
Unused objects are displayed in blue. Purple entries represent generated objects that cannot be edited directly due to references. If objects are located on a locked layer, they are displayed in gray text.