


This chapter describes the "Concrete" and "Reinforcing Steel" material categories, which are important for the concrete design.
Concrete
Once you activate the concrete design, additional tabs appear in the "Edit Material" dialog box for concrete materials, where you can make important settings for the concrete design. The general description of this dialog box can be found in the chapter Materials of the RFEM manual.
Time-Dependent Properties of Concrete

Settings
To include "creep" and "shrinkage" in the design, activate the corresponding option in this section. Further specifications are then taken into account for all structural components with the material assigned. If the creep and shrinkage are deactivated, it is not possible to enter further data in the tab.
Specify the "Relative humidity of ambient environment", the "Concrete age at end of curing", and "Age of concrete at loading". Based on this information, the program determines the creep coefficient φ and the shrinkage strain ε.
Using Time-Dependent Parameters
- In Concrete Design
Activating creep and/or shrinkage in the material dialog box causes them to be taken into account in the “Concrete design” add-on for the deformation and stability analysis. By default, a concrete age of 50 years is used.
- In Structural Analysis
Alternatively, if creep and/or shrinkage is activated in the material and the “Structural analysis | Creep and shrinkage (linear)” analysis type is used, the activated time-dependent effects can already be taken into account in the structural analysis. The load duration can be controlled by defining the start and end times of the load.
Please note that the internal forces of this analysis type must not be additionally subjected to time-dependent effects in the Concrete Design add-on.
Background information on how creep and shrinkage are taken into account in concrete design and with the “Structural analysis | Creep and shrinkage (linear)” analysis type is provided in section Time-Dependent Behavior.
- In Time-Dependent Analysis
The “Time-Dependent Analysis” add-on provides another option for considering time-dependent effects in the concrete or reinforced concrete analysis. The concrete age to be considered can be freely defined in the “Load cases & combinations” dialog box. Further information is provided in the Time-Dependent Analysis manual.
Modification of Concrete Curing
If activating the Creep, you can use the options in the list to modify the concrete maturation process (see the image Time-Dependent Properties of Concrete). These affect the determination of the creep coefficient φ.
- None: There is no adjustment of the creep coefficient φ.
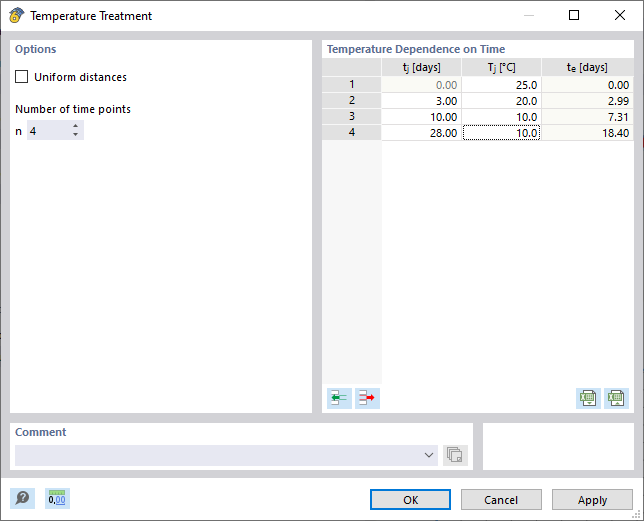
- Temperature Treatment: Click the
 button to open a new dialog box. There, you can define the concrete temperature dependent on time. These parameters influence the equivalent concrete age t0,e. As soon as you have activated the modification using the temperature treatment, you can specify the "Creep Coefficient φe at equivalent time" in the Function Data section.
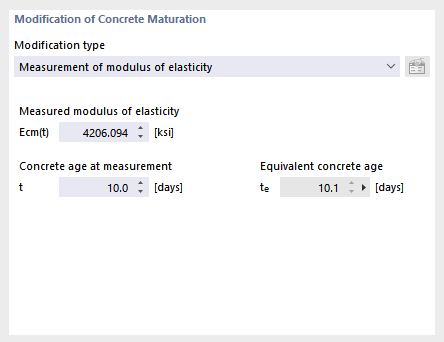
- Measurement of Modulus of Elasticity: If the modulus of elasticity of the concrete was measured on test pieces, you can use this option to replace the calculated value of the creep coefficient φ with the measured value. Enter the "Measured modulus of elasticity" of the test piece and the "Concrete age" at the time of measurement. Based on this information, the program determines the equivalent concrete age t0,e, which again modifies the creep coefficient to φe.
- Measurement of Concrete Strength: This modification option is similar to the option described above. Instead of the measured modulus of elasticity, enter the concrete compressive strength fcm(t), which was measured at a certain point in time t.
Function Data (Only for Visualization)
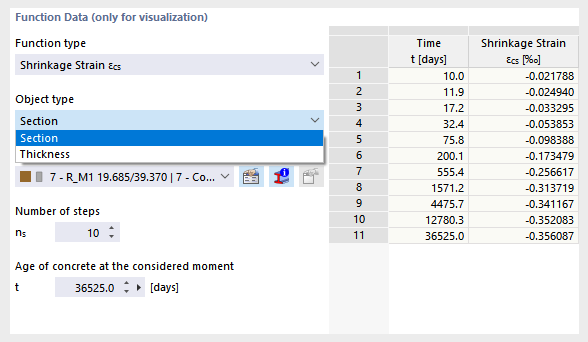
In this section, you can define a cross-section or a thickness of the model and select a "function type" that is shown in the table on the right and in the diagram below. This is only to show the creep and shrinkage function in the value table and as a graph.
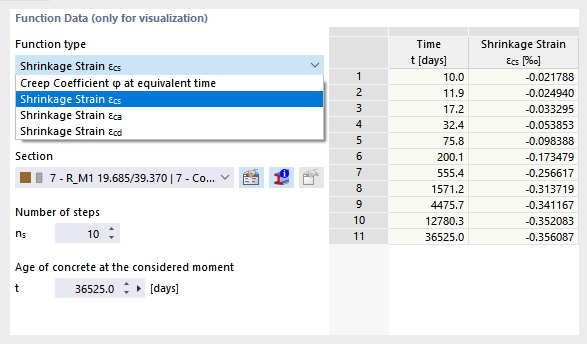
This controls whether the creep coefficient φ or a type of shrinkage strain (total shrinkage strain εcs or its components, drying shrinkage εcd and autogenous shrinkage εca) are displayed as ordinates. Thus, you get the information about the course of the long-term effects in conjunction with the various settings; for example, for concrete maturation.
The results shown depend on a certain "thickness" or a "section".
In the "Number of steps" ns text box, you can adjust the division for the table and the diagram. Ten division points are set by default, so the table has eleven result rows.
The "Age of concrete at the considered moment" t is preset to 50 years; this value is converted into days. If necessary, it is also possible to adjust the values here.
The note "only for visualization" in the title of the section means that only the input parameters for the selected cross-section or the selected thickness are specified and visualized with these values. This allows you to check the influence of the respective parameters. For the calculation, however, the creep coefficients and shrinkage strains are calculated separately at the actual design time. This is particularly relevant for the Time-Dependent Analysis (TDA) add-on (still under development).
Graph
In this section, the function data are shown as a diagram.
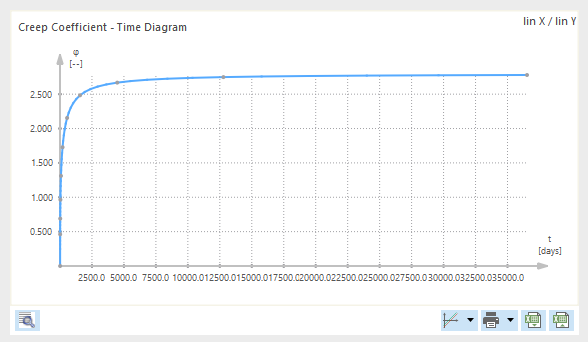
If you move the mouse along the graph, the respective abscissas and ordinates appear. Use the mouse wheel to zoom, use the left mouse button to move the diagram, and double-click the mouse wheel to restore the overall view of the diagram.
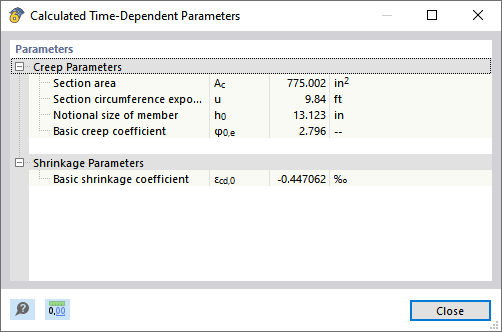
There are several buttons below the diagram. You can use the
![]() button to display the calculated creep and shrinkage parameters in a dialog box.
button to display the calculated creep and shrinkage parameters in a dialog box.
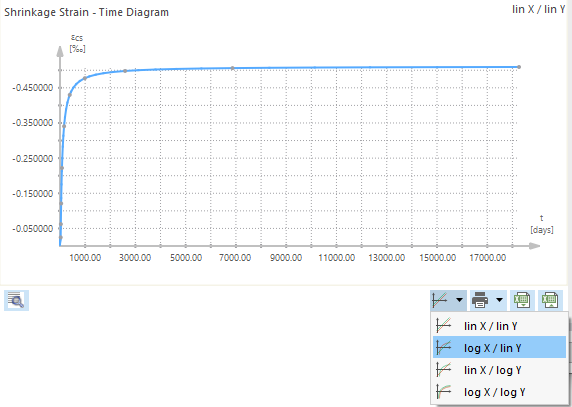
The options of the list button
![]() allow you to display the ordinate and abscissa in a linear or logarithmic scale.
allow you to display the ordinate and abscissa in a linear or logarithmic scale.
It is also possible to print the diagram. The list button
![]() provides you with the following options:
provides you with the following options:
- Print Immediately
- Print Graphics to Printout Report
- Print Graphics to PDF
- Print Graphics to Clipboard
- Print Graphics to File
The various functions are described in the chapter Graphics of the RFEM manual.
Use the
![]() button to export the table values of a diagram to Excel.
button to export the table values of a diagram to Excel.