


Quast
This model for determining the concrete's contribution to tension between the cracks is based on a defined stress-strain curve of the concrete in the tension area (parabola-rectangle diagram).
The basic assumptions of Quast's approach can be summarized as follows:
- Full contribution of the concrete in tension until the crack strain εcr or the factored concrete tensile strength fct,R is reached.
- Reduced stiffening contribution of the concrete in the tension zone according to the existing concrete strain
- No tension stiffening after the governing rebar has started to yield
In summary, this means that the factored tensile strength fct,R is not a fixed value, but refers to the existing strain in the governing steel (tension) fiber. The maximum tensile strength fct,R decreases linearly to zero from the defined crack strain εcr until the yield strain of the reinforcing steel in the governing steel fiber is reached.
This is achieved using the stress-strain relation in the tension area of the concrete (parabola-rectangle diagram), shown in the image below, and by the determination of a reduction factor VMB (stiffening contribution of concrete).
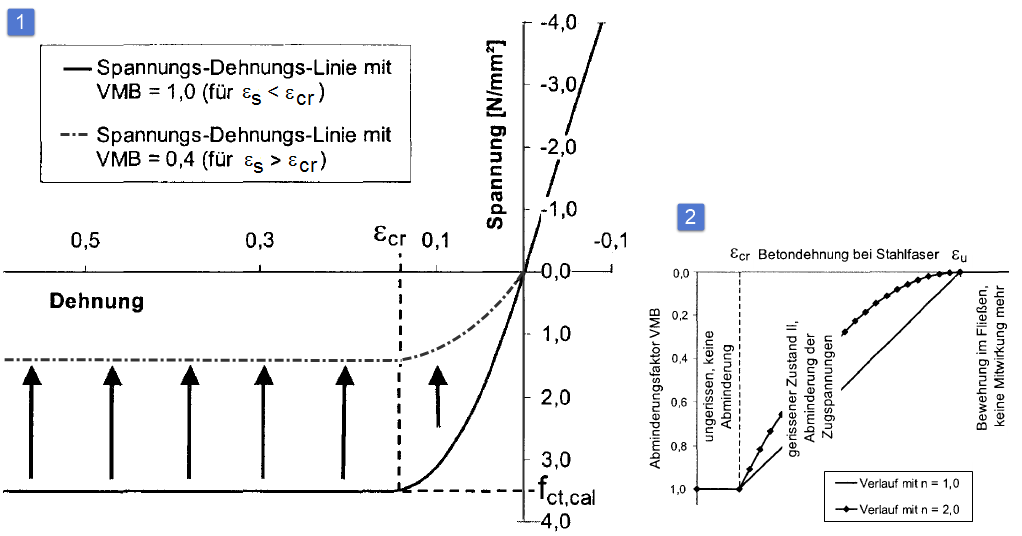
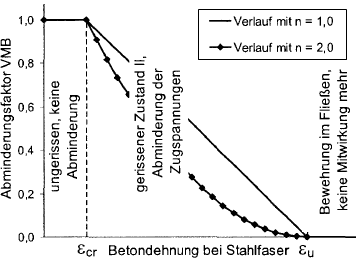
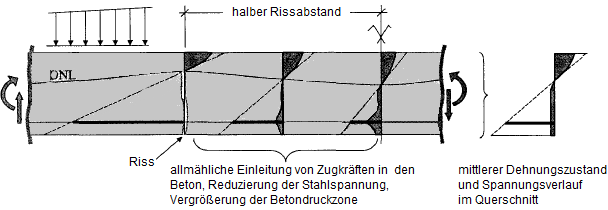
The next image shows a schematic view of stress states for increasing loading due to tension stiffening.
The stress-strain relation in the tension zone can be described with the following equations:
for ε >ε cr
- The curvature of the parabola in the first section can be controlled by the exponent nPR.
- The exponent should be adjusted in such a way that the transition from the compression zone to the tension zone is preferably achieved with the same modulus of elasticity.
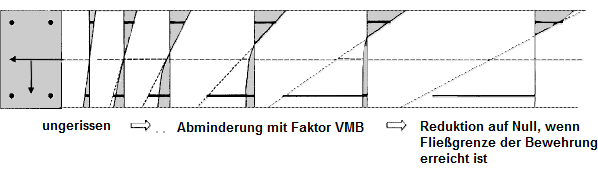
To determine the reduction factor VMB, the strain at the most heavily tensioned steel fiber is used. The position of the reference point is illustrated in the graphic below.

The reduction parameter VMB decreases with increasing steel strain. In the diagram for the VMB factor (see the image below), it is evident that the factor VMB is reduced to zero exactly at the point when the yielding of the reinforcement starts.
The distribution for the reduction factor VMB in state II (ε > εcr) can be controlled by means of the exponent nVMB.
- According to Pfeiffer [2], the values nVMB = 1 (linear) to nVMB = 2 (parabola) are experiential values for structural components subjected to bending.
- Quast [3] uses the exponent nVMB = 1 (linear) in his model, thus achieving good concordance when recalculating column tests.
- According to Pfeiffer [2], pure tension tests with acceptable conformity can be modeled with nVMB = 2.
The assumption of a parabola-rectangle diagram for the cracked concrete tension zone is to be regarded as a calculation aid. At first glance, there are major differences compared to experimentally determined stress-strain curves on the tension side of the pure concrete.
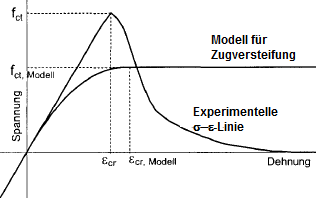
The given stresses in the reinforced concrete cross-section in bending show that the parabola-rectangle diagram is indeed better suited to describe the mean of the strains and stresses.
In a bending beam, a concrete body forms between two cracks. It acts as a sort of wall into which tension forces are gradually reintroduced by the reinforcement. This results in a very irregular distribution of stress and strain. On average, however, a strain level with a parabola-rectangle curve can be created, through which the mean curvature can be determined.
For the model by Quast, the calculation values to be applied were proposed as follows:
- For the tensile strength fct,R
- For the crack strain εcr,R
The calculational value for the tensile strength fct,R is thus smaller than specified by the Eurocode. This is due to the description of the stress-strain relation and the determination of the reduction parameter VMB, in which the assumed tension stress and the resulting tension force are only slowly reduced after exceeding the tension strain. For a strain of 2 ⋅ εcr, there is also an acting tension stress of about 0.95 ⋅ fct,R. Thus, in case of bending, the reduction of the stiffness can be predicted well. For pure tension, the above-mentioned values for fct,R are too small. According to Pfeiffer [2], the values from EC 2 should be applied for the calculation value of the tensile strength.
The values recommended by Quast [3] for fct,R = 1/20 ⋅ fcm can be obtained by applying 60% of the tensile strengths given in EC 2. When applying fct,R = 0.6 ⋅ fctm, the cross-section is predicted to crack too early. At the same time, this already takes into account a reduction in tensile strength under permanent load (about 70%) or a temporarily higher load (e.g. the short-term application of the rare action combination) that leads to a damaged tension zone.
The individual calculation values for the concrete's tension zone can be described as follows: