


The result diagrams in the cross-section show the stress condition in the concrete cross-section and the reinforcement bars. To display this, click the
![]() button. It is available in the result tables of the 'Concrete Design' category for member objects, but not for surfaces.
button. It is available in the result tables of the 'Concrete Design' category for member objects, but not for surfaces.

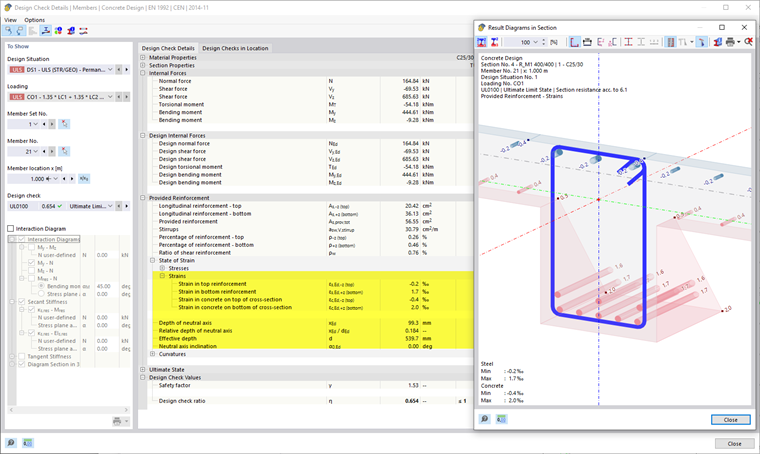
The 'Result Diagrams in Cross-Section' window appears.

The graphic shows the stress condition of the concrete and the reinforcement bars that exists for the current table row result.
You can control the graphic with the mouse as usual. However, the result display can also be adjusted using the buttons in the toolbar. They are assigned the following functions:
| Button | Function |
|---|---|
|
|
Shows values in all stress points and reinforcement bars |
|
|
Shows only extreme values of positive and negative stresses |
|
|
Allows scaling of the stress diagrams via factor in [%] |
|
|
Displays cross-section contour |
|
|
Displays dimensioning |
|
|
Displays axis system |
|
|
Displays shear center |
|
|
Displays stirrup reinforcement |
|
|
Displays graphic in perspective projection |
|
|
Opens 'Cross-Section Information' window |
|
|
Enables printing of the current display |
|
|
Shows a full view of the result diagrams in the cross-section |
If you want to display the strains of the cross-section and the reinforcement, also open the Design check details dialog for the same table row (without closing the result diagrams). There, in the 'Provided Reinforcement' → 'Strain Condition' category, select one of the rows for the strains.
Graphic Printout
With the list button
![]() , you can directly print the current graphic, save it as a PDF, or send it to the printout report. The details to be displayed can also be specified in the print preview.
, you can directly print the current graphic, save it as a PDF, or send it to the printout report. The details to be displayed can also be specified in the print preview.
