A navigator is displayed on the left of the work window, showing the data of the opened file(s) in a tree structure. By clicking the
![]() symbol, you can open the entries for a branch, and you can use
symbol, you can open the entries for a branch, and you can use
![]() to close them again. Double-clicking an entry has the same effect.
to close them again. Double-clicking an entry has the same effect.
When you "grab" the navigator with the pointer in its title bar, you can move it into the workspace. To dock it, double-click the title bar or move the navigator to the window frame.
At the bottom of the navigator, there are two tabs (or three after the calculation). They allow you to switch between the navigators "Data", "Display", and "Results".
Navigator – Data
The Navigator – Data manages the model data, internal forces, and calculated results.

Entries are typically displayed in black text. Incorrectly defined objects appear in red, and unused objects in blue. Purple entries represent generated objects that cannot be edited directly due to their references. Objects on a locked layer are indicated by gray text.
Navigator – Display
The Navigator – Display controls the graphical display of objects in the work window.

If you clear the check box of an entry, the object or attribute is hidden.
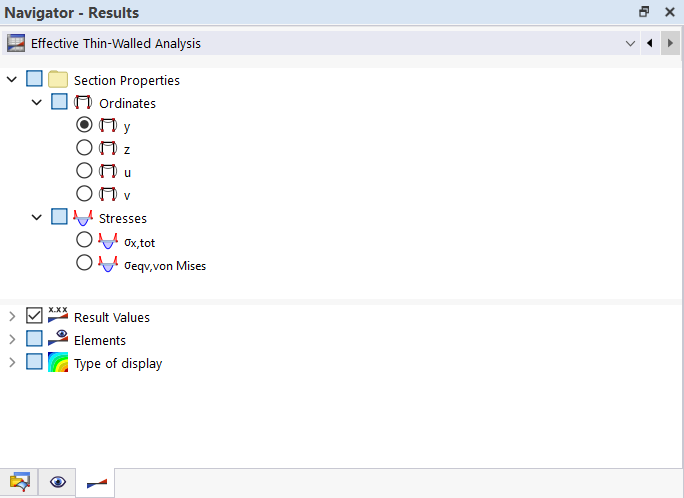
Navigator – Results
The Navigator – Results controls the results that are displayed in the graphic.