


The control panel is shown when results are available in the work window. It provides various display and control options. You can display and hide the panel by clicking Control Panel in the View menu. Alternatively, use the
![]() button.
button.

The control panel consists of the Colors and Factors tabs.
Colors
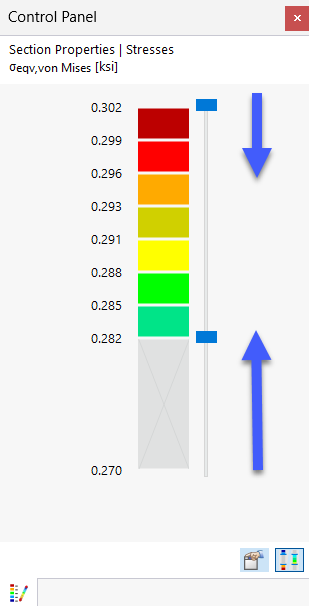
In the case of a multicolored results graphic, the first tab displays the color scale with the assigned value ranges.

The standard is an eleven-step color scale that covers the range between the extreme values at equal intervals.
Editing Colors
To adjust the color scale, double-click one of the colors or click the
![]() button in the panel. The "Edit Result Colors" dialog box appears.
button in the panel. The "Edit Result Colors" dialog box appears.

To change a color, double-click the corresponding color field. You can adjust the color in the "Select Color" dialog box.
Editing Values
This feature is still in preparation.
Adjusting Color Ranges
To reduce the number of color ranges, use the slider next to the color scale. You can reduce the ranges from both ends.
Use the
![]() button to switch between the outer and inner value ranges. This way, you can display only ranges with extreme values, for example.
button to switch between the outer and inner value ranges. This way, you can display only ranges with extreme values, for example.

Factors
In the "Factors" tab, you can adjust the scaling factors for the graphical display.

The display factors are sorted by result categories in a navigator tree. A red triangle marks the text box for the current result graphic.