


This model for determining the concrete's contribution to tension between the cracks is based on a defined stress-strain curve of the concrete in the tension area (parabola-rectangle diagram).
The basic assumptions of the approach by Hsu and Mo [1] can be summarized as follows:
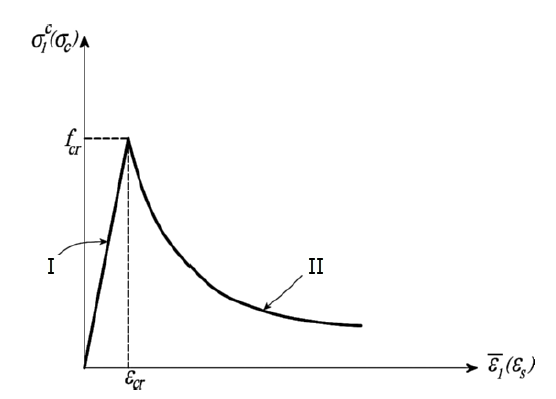
- Until reaching the crack strain εcr or the factored crack stress of concrete fcr, the concrete is fully effective in tension. The stress-strain diagram shows a linear behavior.
- When cracking begins, a downward concave distribution of the stress-strain relation is shown.
- A greatly reduced stiffening effect of the concrete in the tension zone remains.
In summary, this means that the stress-strain relation for tensile stress can be divided into two areas. Before the cracking, the relation between stress and strain is essentially linear.
After the cracking, there is a strong decrease in strength. The downward curve shows a concave distribution. The concrete is cracked in the descending branch, and the concrete tensile stress σc1 and concrete tensile strain ε1 differ significantly from those before the cracking.
σc1 is defined as the mean (smeared) concrete tensile stress and ε1 is the mean (smeared) concrete tensile strain.
The following image shows the distribution of the stress-strain relation for reinforced concrete in the tensile area, taking into account tension stiffening according to the approach of Hsu and Mo.
The stress-strain diagram in the tensile area can be described using the following equations according to [1.
- For 0 < ε < εcr
|
|
Average (smeared) crack strain according to Hsu and Mo |
|
|
Modulus of elasticity for concrete |
- For ε > εcr
|
|
Crack strain of concrete |
|
|
Analytical crack stress of concrete |
|
|
Average (smeared) crack strain according to Hsu and Mo |
|
|
Exponent for controlling function course |
In RFEM 6, the curve shape is supplemented by the parameter εct,max, which can be used to limit the tensile strength. As of the strain εct,max, the tensile strength is reduced to zero.