


During the calculation, a diagram with the course of the maximum displacement is displayed (see image Calculation progress ). You can also examine this diagram in full detail after the calculation. Additionally, you have the option to create user-defined calculation diagrams (BD) that represent the convergence behavior at specific nodes of members, surfaces, or supports. Use the navigator category Calculation Diagrams for this.
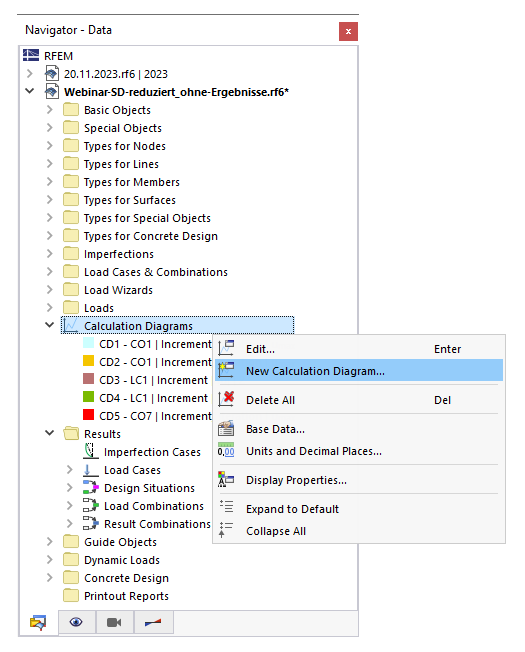
In the 'New Calculation Diagram' dialog, you can define the criteria that apply to the display of the results in the diagram.

Base
If no results are available yet, only the Base tab is available.
Diagram type
Several diagram types are available for selection in the list:
- 2D | Base: You can individually specify which results are to be displayed on the horizontal and vertical axes of the diagram.
- 2D | Convergence diagram: The diagram shows how the maximum deformation develops during the calculation.
- 2D | Group: You can display the results of multiple diagrams in the diagram, which are available for the same objects and result types.
- 2D | Chained calculation diagram: You can display the results of an initial load case and a final load case, for example, to analyze the effects of multiple loading and unloading (hysteresis diagram).
The further input options are tailored to the diagram type.
Source
You can select the 'Analysis type' in the list, to whose results the diagram should refer. If no analysis add-on is activated in the model base data, only the 'Structural analysis' is available.
Define the load case or the load combination whose results are to be displayed in the diagram. Result combinations and design situations are not available for selection because the diagram cannot represent enveloping results.
Horizontal Axis / Vertical Axis
In these two sections, you can define the result criteria that should apply to the abscissas and ordinates. The selection options in the 'Result type' list depend on the diagram type.
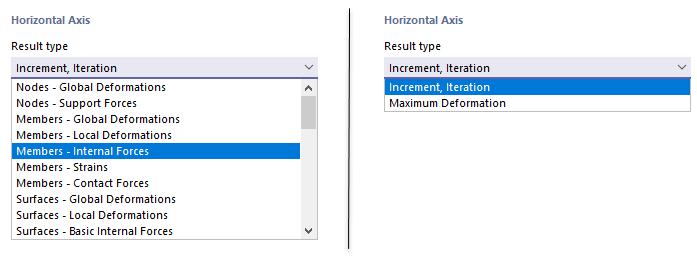
Define the result type for the horizontal axis. Usually, this is the 'Increment'. For a base diagram, you can then assign a deformation or internal force to the vertical axis; for a convergence diagram, the maximum deformation.
For a base diagram, select the displacement, rotation, or internal force type in the 'Value' list. Then define the 'Object' whose result is to appear in the diagram and specify for which 'Node' this is done.

For a chained calculation diagram, you can define the load cases or combinations to display the overall result of construction stages or load conditions, for example, to analyze the hysteresis behavior of a plastic material model.

Diagram
The diagram is displayed as soon as results of the load case or load combination are available. If you change a criterion, the graphic updates automatically. In the Diagram tab, you can examine the diagram in a large view.
The green bar below a convergence diagram (see dialog New Calculation Diagram) corresponds to the convergence course as shown in the Calculation progress window.
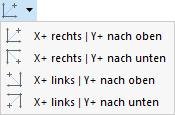
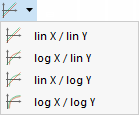
The buttons below the diagram are assigned the following functions:
| List button with options for the alignment of abscissa X and ordinate Y | |
| List button with options for linear or logarithmic display of X and Y values | |
|
|
List button with options for printing the diagram |
|
|
Increases the length of the abscissa X |
|
|
Decreases the length of the abscissa X |
|
|
Increases the length of the ordinate Y |
|
|
Decreases the length of the ordinate Y |
|
|
Displays diagram with filled course |
|
|
Specifies maximum and minimum value |
Table
The Table tab is available as soon as the results of the load case or load combination are available.

The table lists the values that were calculated in the individual iterations and load increments. As mentioned above, the results of the individual load steps must be saved for an incremental calculation.
The values of the selected row are marked in the diagram on the right.
Diagram
The Diagram tab is available as soon as the results of the load case or load combination are available.

The diagram is displayed here in a full view. This facilitates targeted evaluation.
The list button
![]() offers various options that you can use for the documentation of the diagram (see chapter Graphics).
offers various options that you can use for the documentation of the diagram (see chapter Graphics).