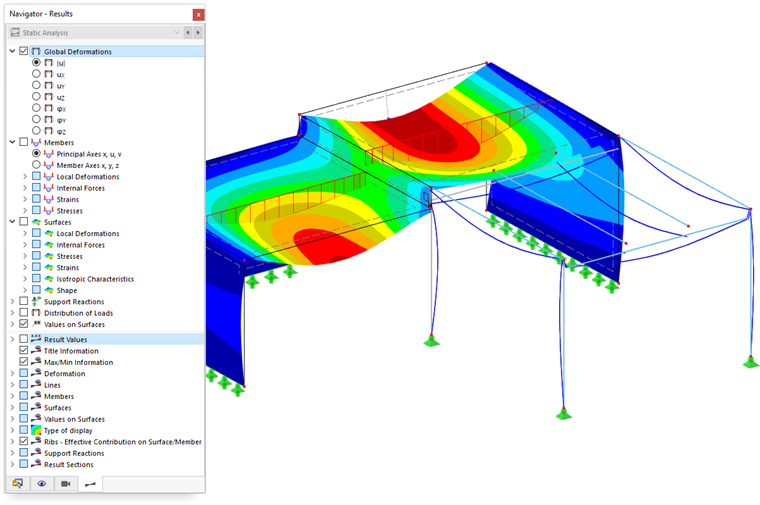
After an error-free calculation, the results are displayed on the model. The navigator gets an additional tab: In the Navigator – Results, you can control the results that are displayed graphically.
The table manages the results including individual result types in the Static Analysis category.
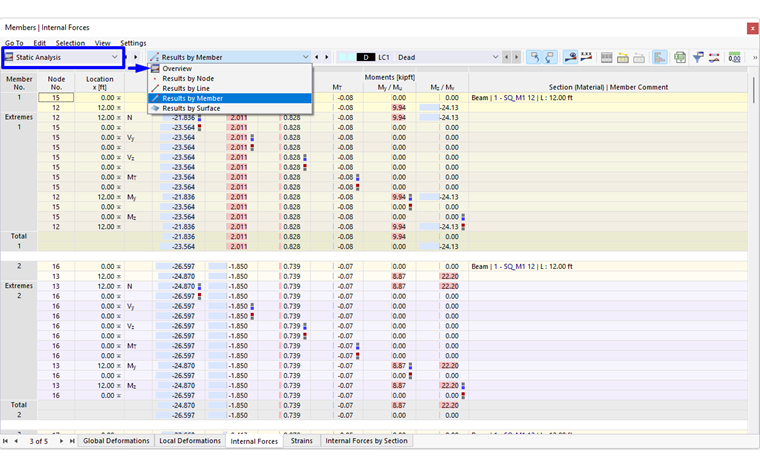
The numerical results are organized in the following subcategories:
- Overview
- Results by Node
- Results by Line
- Results by Member
- Results by Surface
- Results by Solid
Result Table Manager
The "Result Table Manager" controls the tables that are displayed. You can open this dialog box by clicking the Result Table Manager item in the Results menu. As an alternative, you can use the
![]() button in the title bar of the program or table.
button in the title bar of the program or table.
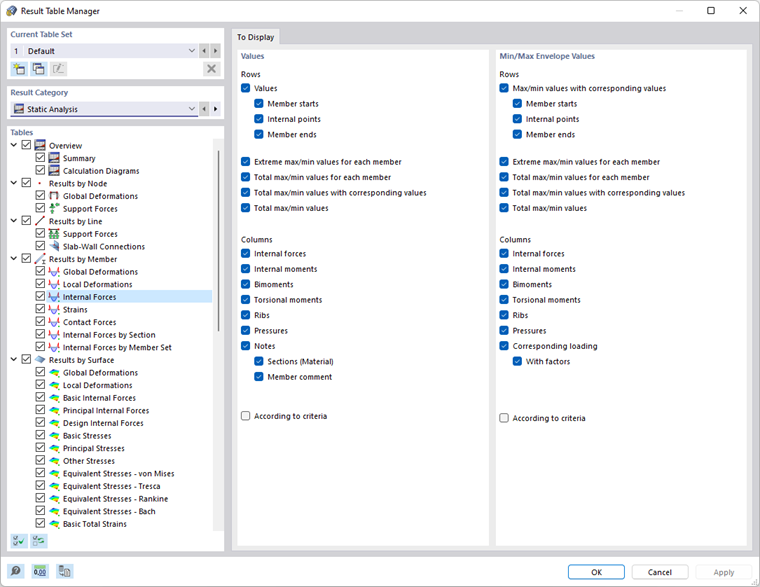
In the "Current Table Set" section, you can create a new table configuration and use it in the current model.
Use the check boxes in the "Tables" tree to define the results you need for the evaluation. When you select an entry, you can control in detail the output of results in the "To Display" section. The corresponding table rows and columns will be displayed or hidden accordingly.
The "According to criteria" check box allows you to display certain result values in the tables. You can define the criteria for the results output in separate tabs.
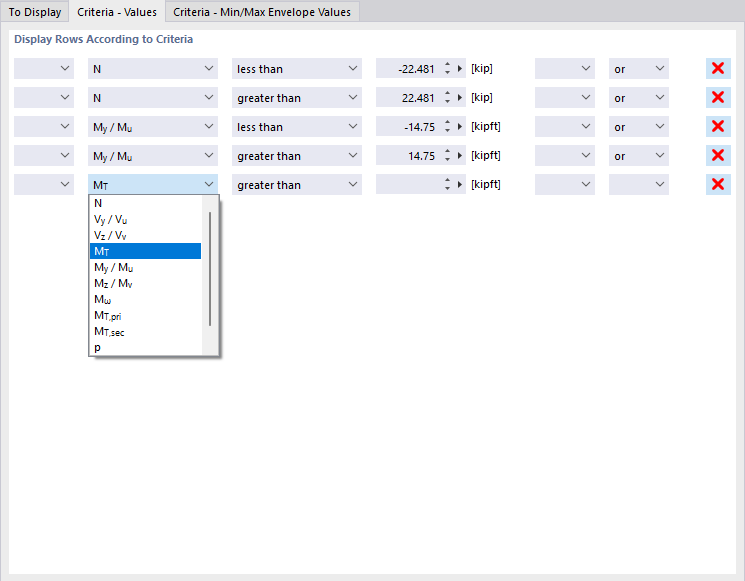
Select the result type in the second column. In the next two columns, you specify the criterion that is to be applied. The following conditions are available for selection:
- Equals
- Does not equal
- Greater than
- Greater than or equal to
- Less than
- Less than or equal to
To define another criterion, select the "or"-entry (each criterion counts for itself) or "and" (each criterion must be fulfilled) in the last column. Then, define the next condition in the new line.