


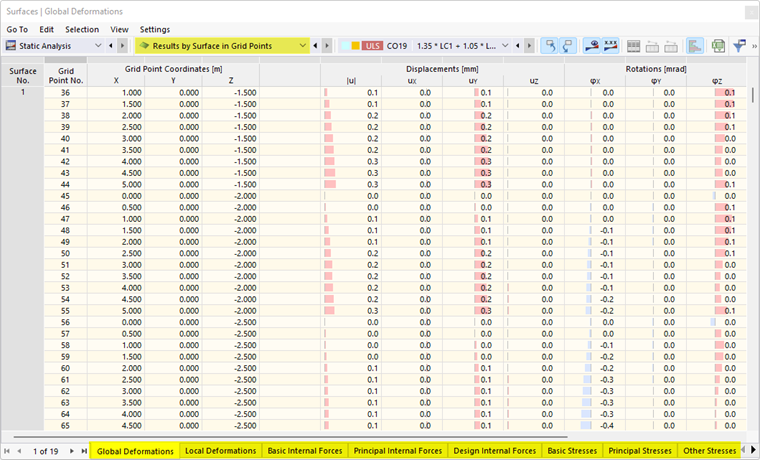
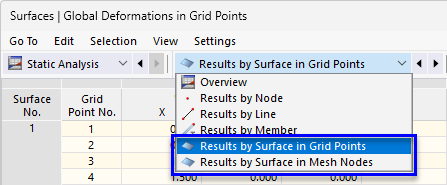
You can display the results for surfaces graphically, using the Surfaces navigator category. You will find the numerical results of surfaces in the table categories Results by Surface in Grid Points and Results by Surface in Mesh Nodes.
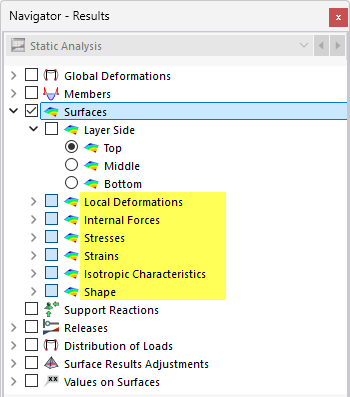
FE Mesh Nodes and Grid Points
The graphical results are based on the results at the FE mesh nodes. In addition to these FE mesh node results, the table also includes the interpolated values at the grid points, which are defined for each surface (see the chapter Surfaces). This grid represents an output at result points with regular spacing that is independent of the FE mesh.
The result values for the grid points can also be displayed in the graphic. This option is described in the chapter Result Values on Surfaces.
Layer Side
The Layer Side check box allows you to quickly switch between the results for the top and bottom sides as well as the center of the surfaces.
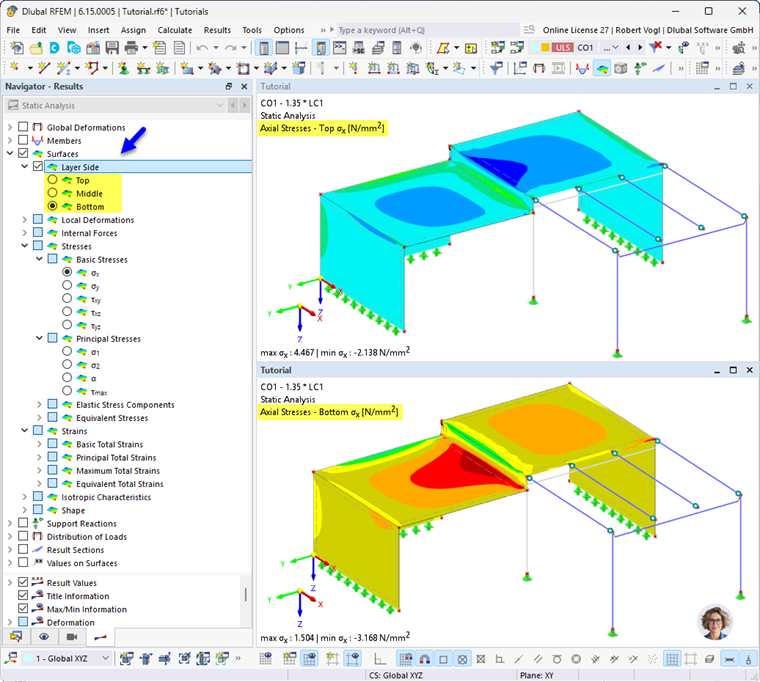
This allows you, for example, to check the stresses and strains that occur on the sides of surfaces subjected to bending. The surface internal forces, on the other hand, are always related to the results for the surface centers from the FE analysis (plane of the wireframe model).
If the “Layer Side” check box is deactivated, you can select the results for the surface sides using the check boxes for stresses and strains (σx+, σx-, εx+, εx-, and so on.).
Top / Bottom
If the local z-axis is oriented downward in the local-axes model base data is oriented downward, the Top surface side is in the direction of the negative z-face axis (−z), and the Bottom surface side is in the direction of the positive z-axis (+z). If the local z-axis is oriented upward, this definition is reversed.