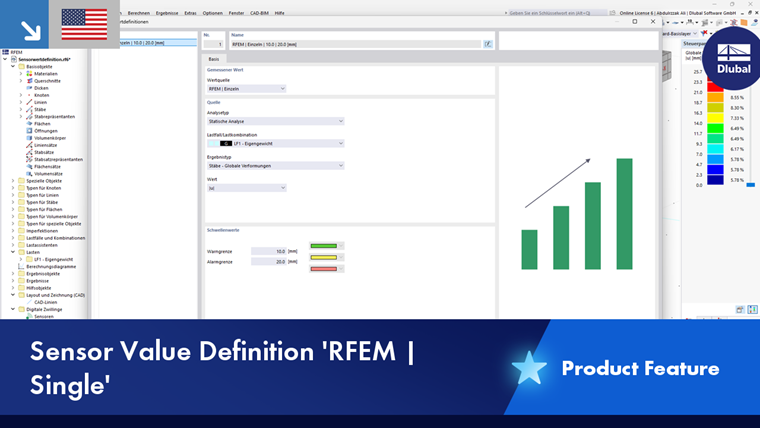
In the Sensor Value Definitions dialog box, you can define sensor types and describe the basis on which the sensor values are determined and which parameters are available.
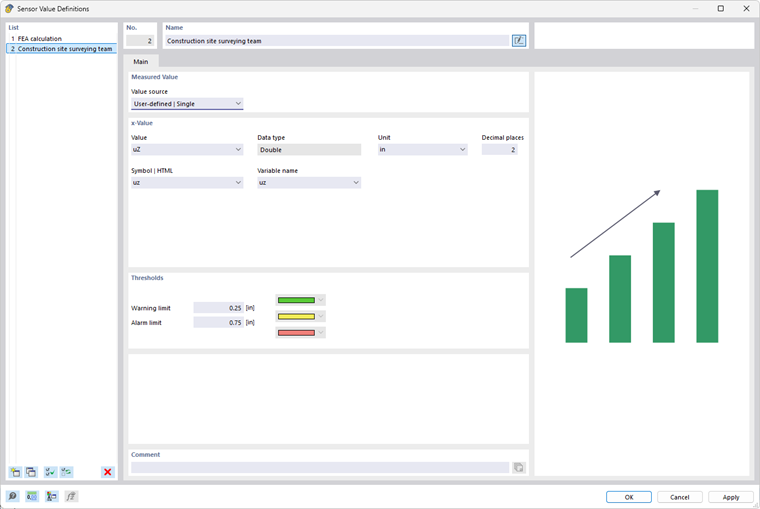
Measured Value
The concept of the dialog box is aligned with the “Original Value” setting. The list provides four options to select from:
- User-defined | Single (see the image Dialog Box “Sensor Value Definitions”)
- User-defined | Function (see the image Original Value “User-Defined | Function”)
- RFEM | Single (see the image Original Value “RFEM | Single”)
- RFEM | Function (see the image Function”)
x-Value / y-Value
For the User-defined | Single or User-defined | Function original value, define the descriptions and parameters for the measured value individually. If there is a deformation, for example, as shown in the image above, you can describe the value as “uz”, set the unit to “mm”, and specify “1” for the number of decimal places. For a noise source, on the other hand, you could enter the value “Lp” and the unit “dB.”
Entries under “Symbol | HTML” and “Variable Name” is useful if you are importing measurement data via parameterized functions.
When describing the original value as a function—for example, to model a value’s dependence on time—you can define the parameters for the x-axis and y-axis of a graph in the “x-Value” and “y-Value” sections.
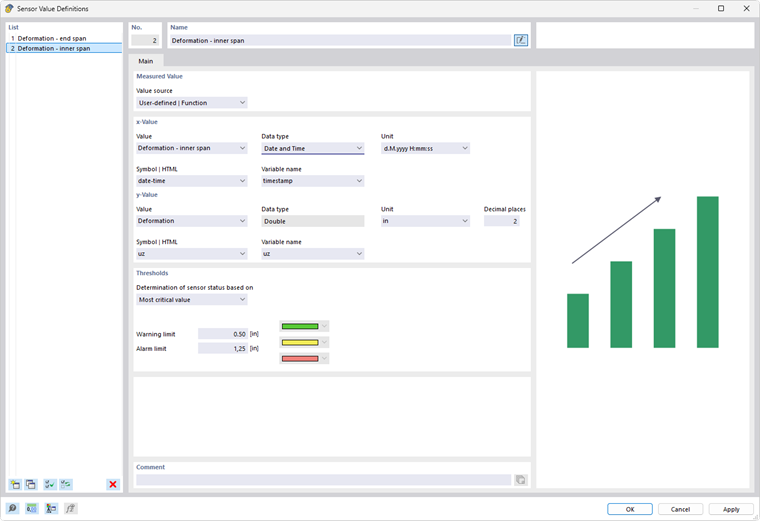
For the x-value of the x-axis, the “Data type” list provides a selection that can be used to specify various use cases:
- Double (Double Precision)
- Date and time
- Date
- String ([https://en.wikipedia.org/wiki/String_(computer_science) String])
Source
For the RFEM | Single or RFEM | Function original value, specify which RFEM results are used for the measured value.
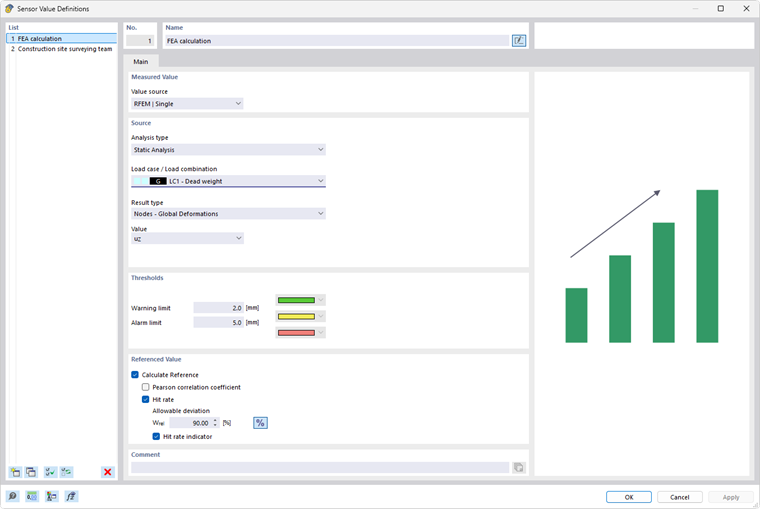
Select the “Analysis type” (structural analysis, modal analysis, and so on) and the “Load case” or “Load combination” with the corresponding results. Result combinations and design situations are not suitable for sensor value definitions because they provide envelope results.
Then, specify the “Result type” (internal force, deflection, support force, strain, and so on) and the relevant “Value,” such as the deflection in a specific direction or the strain related to an axis.
When describing the original value as an RFEM function, you can use the “Result type” and “Function result type” lists to define the parameters of a diagram.
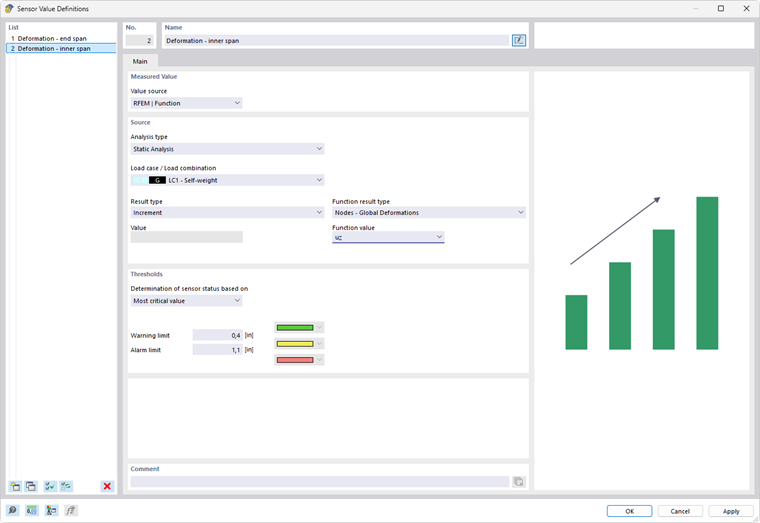
The criteria are defined in the same way as for calculation diagram monitors of RFEM 6 results.
Thresholds
In this section, define the values for the “Warning limit” and the “Alarm limit.” The corresponding colors are assigned to the associated ranges:
- Green: The measured value is within the acceptable range.
- Yellow: The measured value triggers a warning.
- Red: The measured value triggers an alarm.
The colors are used in the Measured Values tab to indicate the status of the sensor measurements.
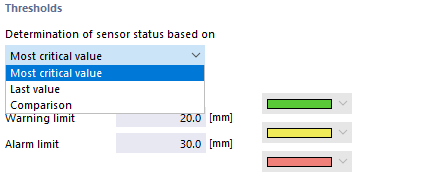
If the original value is based on a function, you can specify which threshold value is relevant for “Determinination of sensor status” from a list.
Referenced Value
This section is displayed for the “RFEM | Single” original value (see the image Original Value “RFEM | Single”). Here, you can specify which deviations and match rates from measured results are allowable for the calculated results. This is useful, for example, when comparing wind simulations with results from wind tunnel tests. For instance, the WTG guideline [1] defines an evaluation function based on the prediction model’s match rate q, using the “correctly” calculated result values in comparison to sufficiently significant reference values.
The results of the statistical analysis are displayed in the Sensor Sets dialog box.